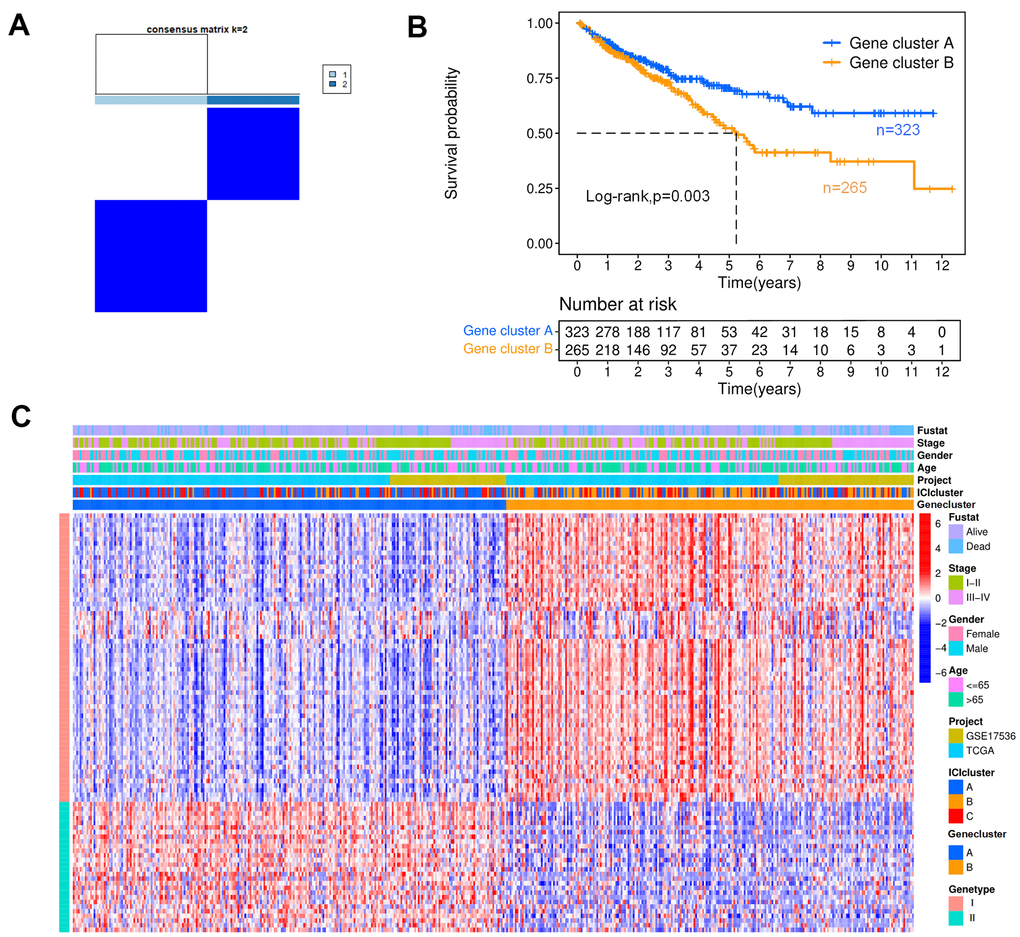
Figure 3.Genotyping analysis. (A) In a cluster analysis based on the K-means algorithm, the colon cancer patients were classified into two subgroups, designated gene clusters (A, B). (B) The Kaplan-Meier curves for patients with gene clusters (A, B) (Log-rank test, p=0.003). (C) Heat map of DEGs. Rows represent colon cancer samples with different subtypes and clinical status; columns represent tumor-infiltrating immune cells.