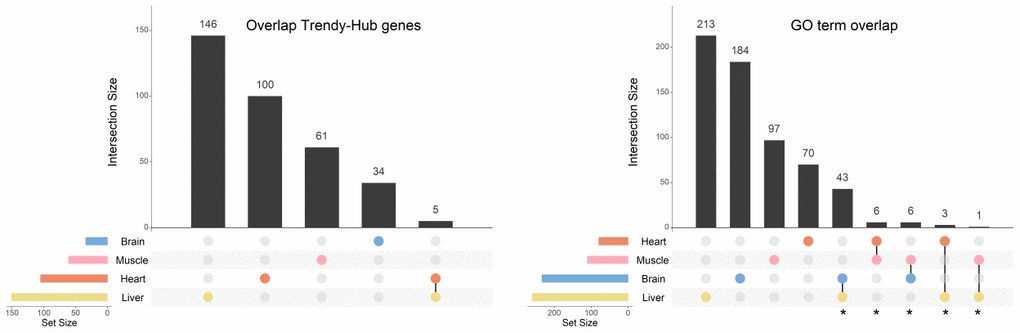
Figure 5.Overlap of genes and biological processes between the brain, heart, liver, and muscle. Upset plots depicting the gene overlap between Trendy genes, module genes, and hub genes per tissue (left), as well as the overlap of the enriched GO terms in the same tissues (right). Bars represent intersection size and colored circles depict the gene/GO term sets involved. Each tissue's gene list results from the intersection of Trendy, module, and hub genes. For this plot we considered all significantly age-associated modules and the significantly-sex associated modules with an observable increase/decrease in gene expression over time (i.e., liver tan, blue, cyan and Darkgrey modules, and muscle blue module). In tissues with more than one significant module (i.e. the heart, the muscle and the liver), the gene list results from the combination of each module's intersection, and the GO term list results from the combination of each module's GO terms. GO terms in common at least in two tissues were considered for further analysis (identified with *).