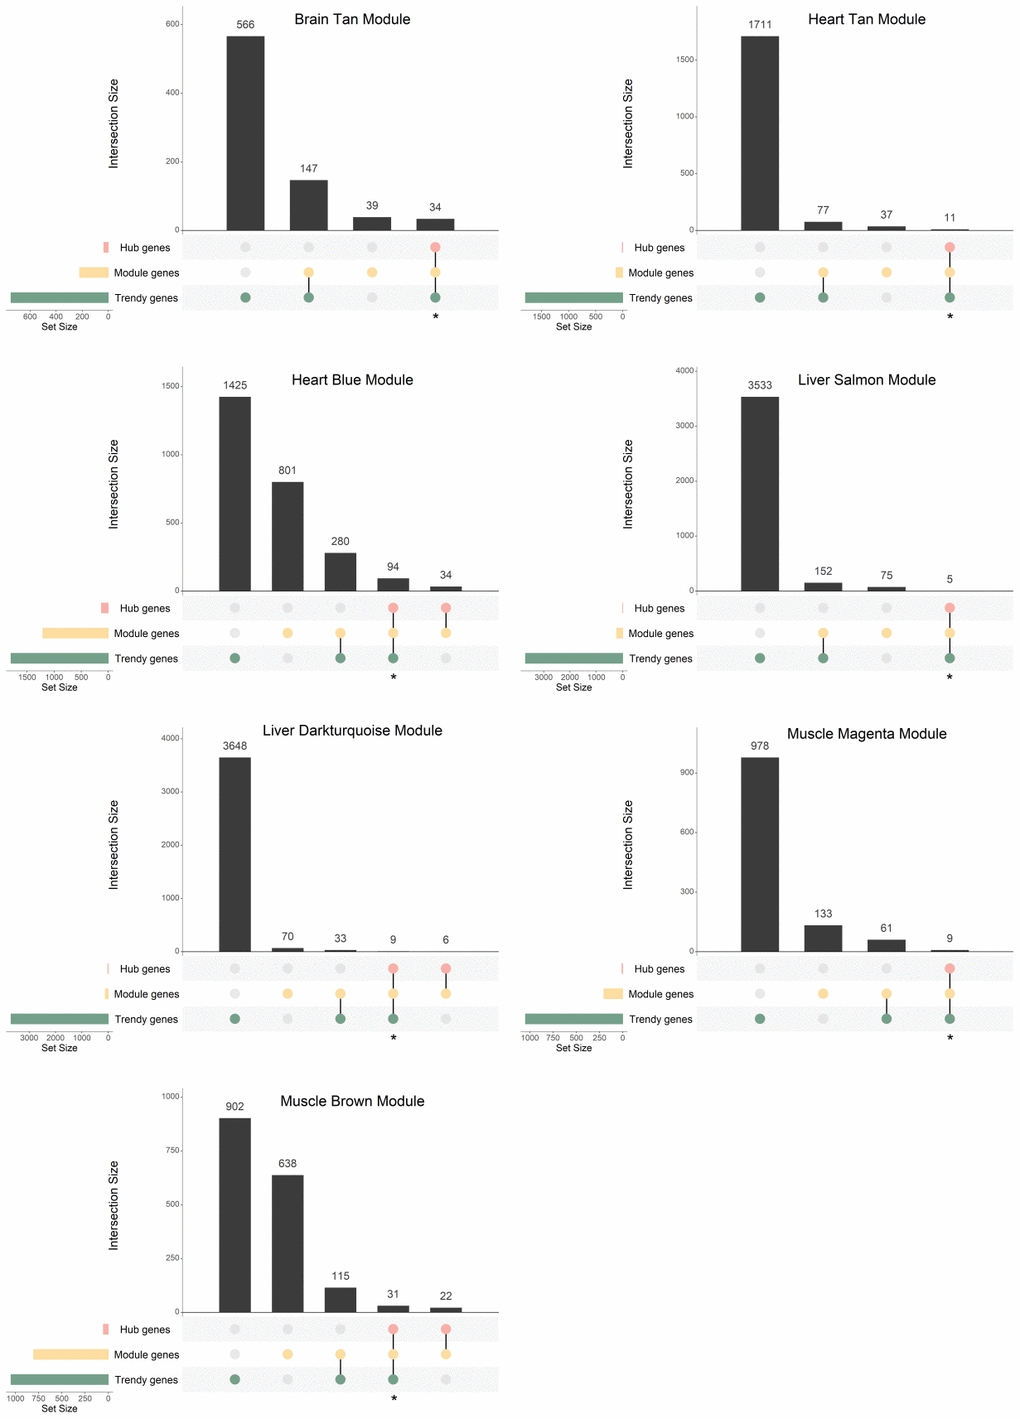
Figure 4.Gene overlap between Trendy genes, module genes, and hub genes in the age-associated modules with significantly enriched GO terms. Bars represent intersection size and colored circles depict the gene sets involved. Genes in common in the Trendy and hub gene sets were considered for further analysis (identified with *).