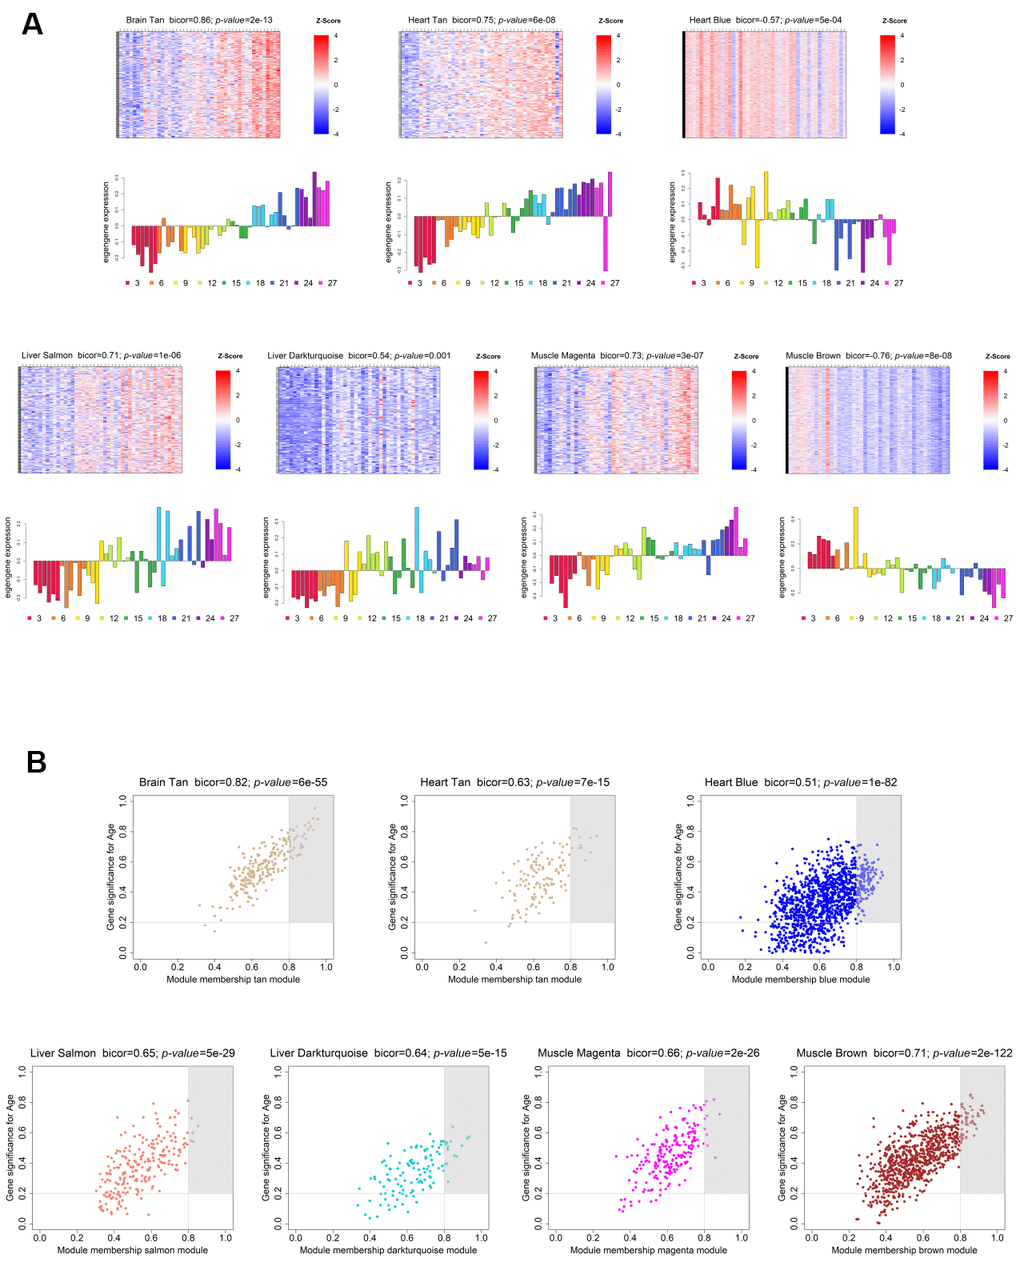
Figure 3.Weighted gene co-expression network significantly age-associated modules. (A) Gene expression profile of each significantly age-associated module. The heatmaps (top) display the standardized expression (z-score) of individual genes (rows) per sample (columns), whereas the bar plots (below) represent the ME expression profile. Each bar of the bar plot corresponds to the same samples of the heatmap. Negative (positive) values of ME expression relate to the under-expression (over-expression) of genes in each module’s heatmap (blue and red colors, respectively). (B) Intramodular hub gene identification. For each module, genes with individual GS > 0.2 and MM > 0.8 were considered to be the most functionally important (inside grey rectangles).