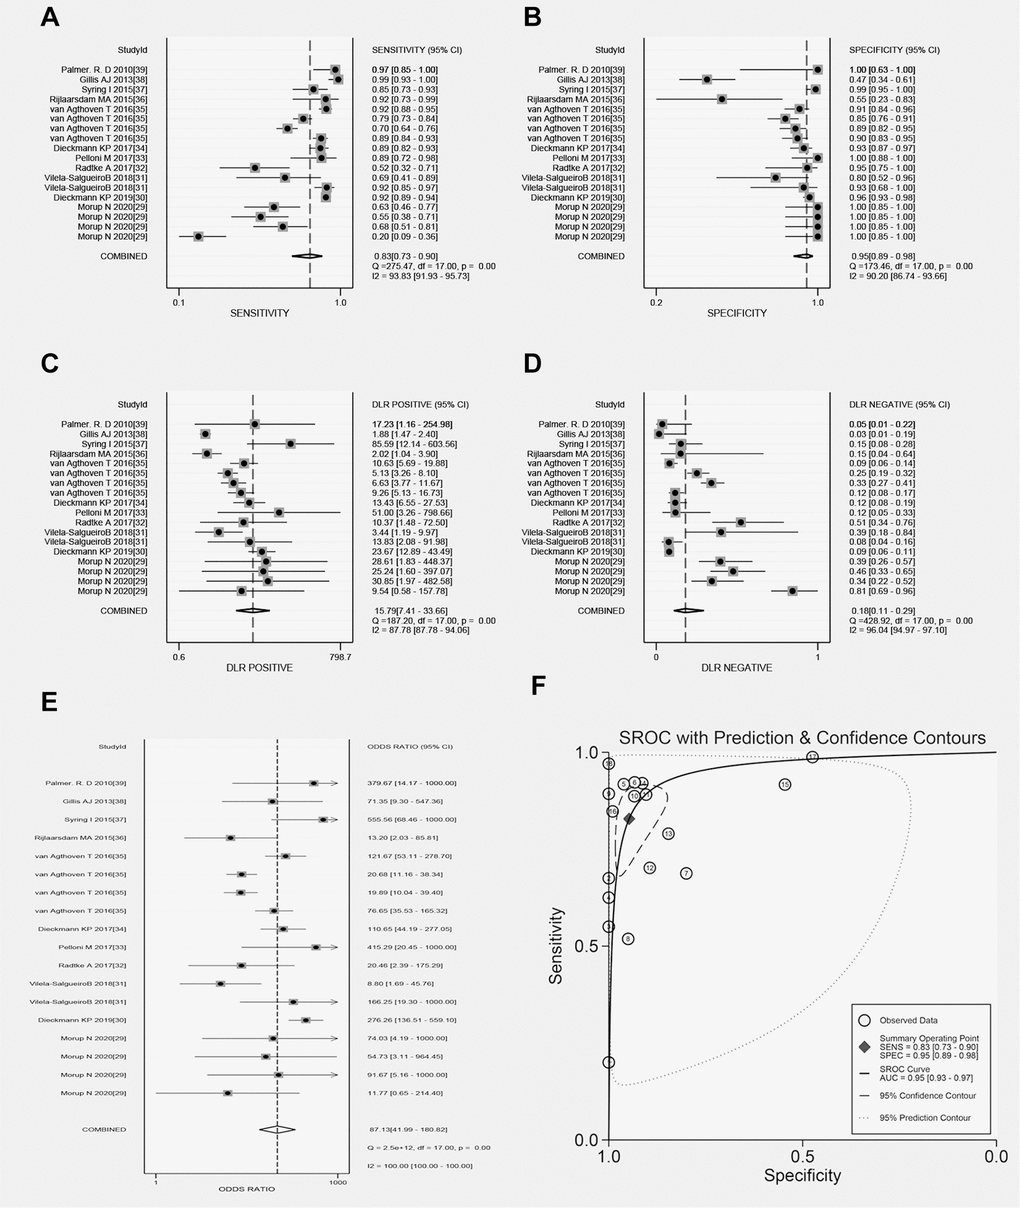
Figure 3.Forest plots of total microRNAs. (A) Sen of total microRNAs in TGCT; (B) Spe of total microRNAs in TGCT; (C) PLR of total microRNAs in TGCT; (D) NLR of total microRNAs in TGCT; (E) DOR of total microRNAs in TGCT; (F) AUC of total microRNAs in TGCT.