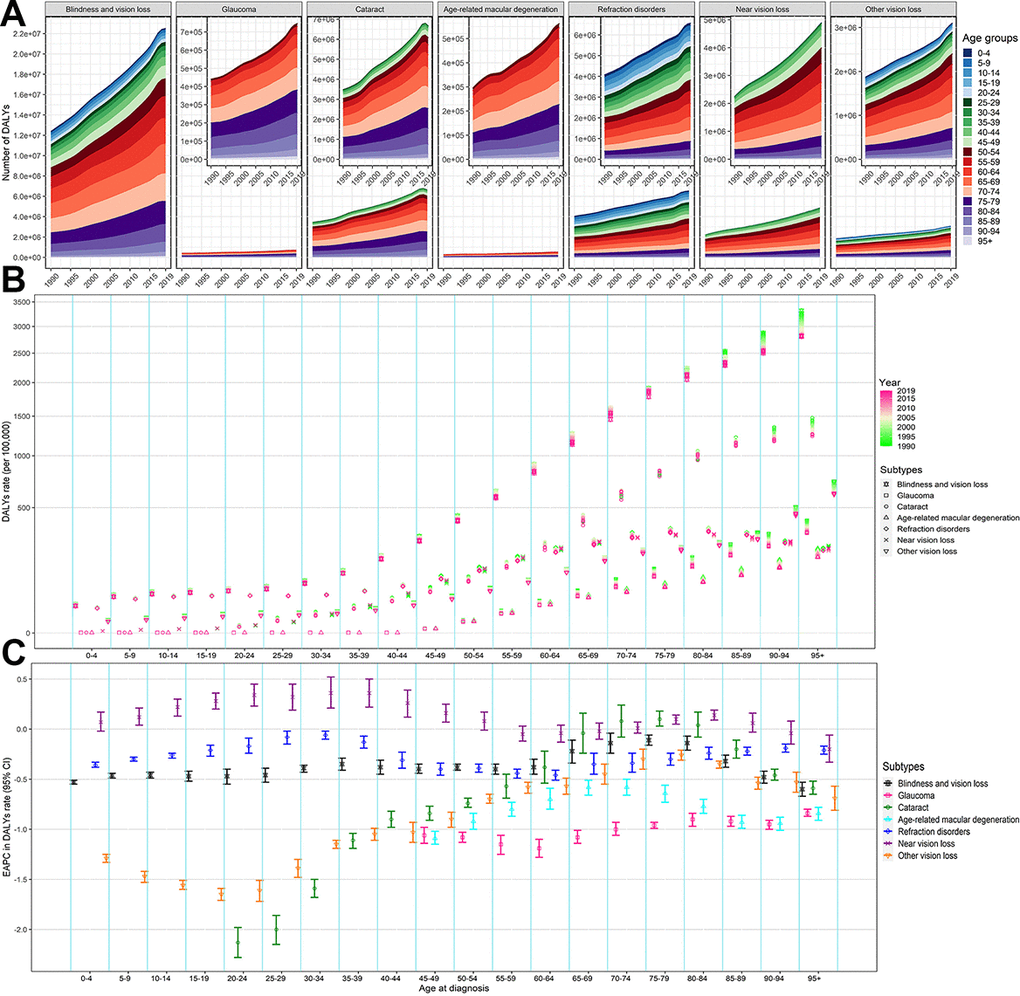
Figure 4.The change of DALYs of BVL by different eye diseases and age groups, both sexes, from 1990 to 2019. (A) Number of DALYs; (B) DALYs rate; (C) EAPC in DALYs rate. The figures of six eye diseases are further enlarged in its top-right panel. BVL, blindness and vision loss; DALYs, disability-adjusted life years; EAPC, estimated annual percentage change.