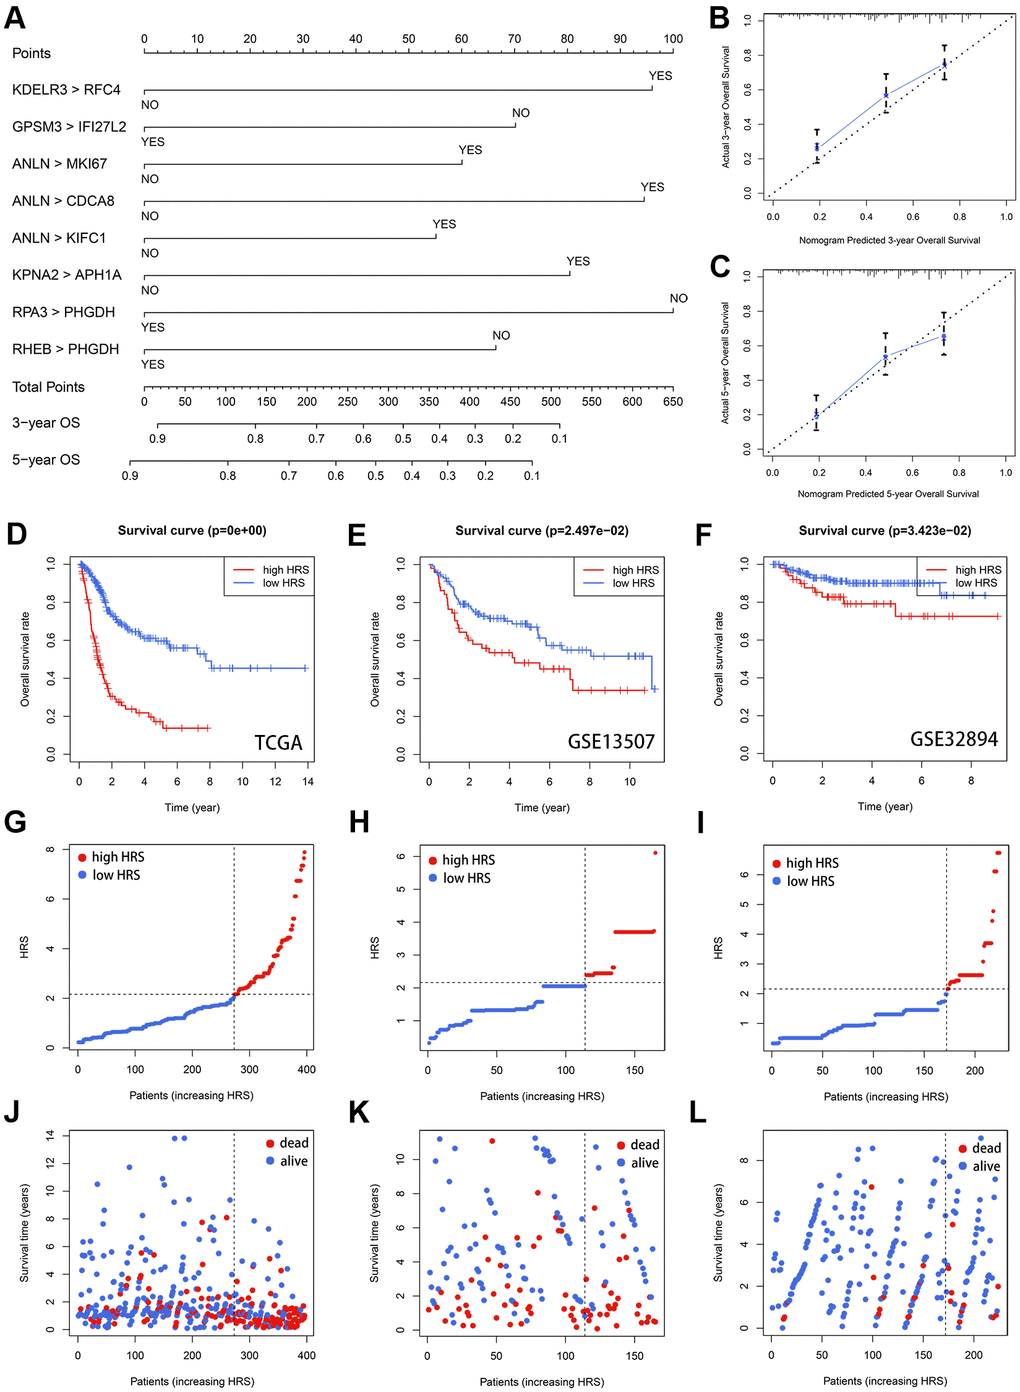
Figure 4.Validation of HRS. (A) A nomogram was plotted to visualize the HRS. (B, C) The calibration curves for 3- (B) and 5-year (C) OS prediction. (D–F) Kaplan-Meier survival analysis of HRS in TCGA (D), GSE13507 (E) and GSE32894 (F) cohorts. (G–I) The distribution of HRS in TCGA (G), GSE13507 (H) and GSE32894 (I). (J–L) The distribution of survival status in TCGA (J), GSE13507 (K) and GSE32894 (L).