Submit an Article
Navigate
Home
Editorial Board
Editorial Policies
Current Volume
Archive
Scientific Integrity
Publication Ethics Statements
Interviews with Outstanding Authors
Newsroom
Sponsored Conferences
Podcast
Contact
Special Collections
Submit an Article
Online ISSN: 1945-4589
Research Paper
|
Volume 13, Issue 14
|
pp. 18993–19012
A network pharmacology approach to uncover the key ingredients in
Ginkgo Folium
and their anti-Alzheimer’s disease mechanisms
Back to article
Figure 6
(6 of 8)
−
100%
+
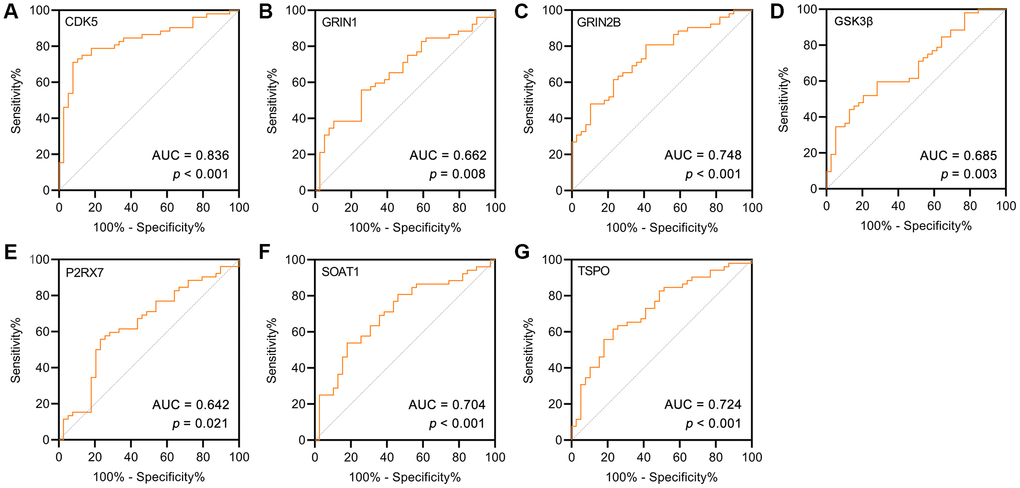
Figure 6.
(
A
–
G
) ROC curve for the AD and controls on potential targets of GF. As a reference, a curve with an AUC of 0.5 was plotted (dashed line).
Figure 6 — A network pharmacology approach to uncover the key ingredients in Ginkgo Folium and their anti-Alzheimer’s disease mechanisms | Aging