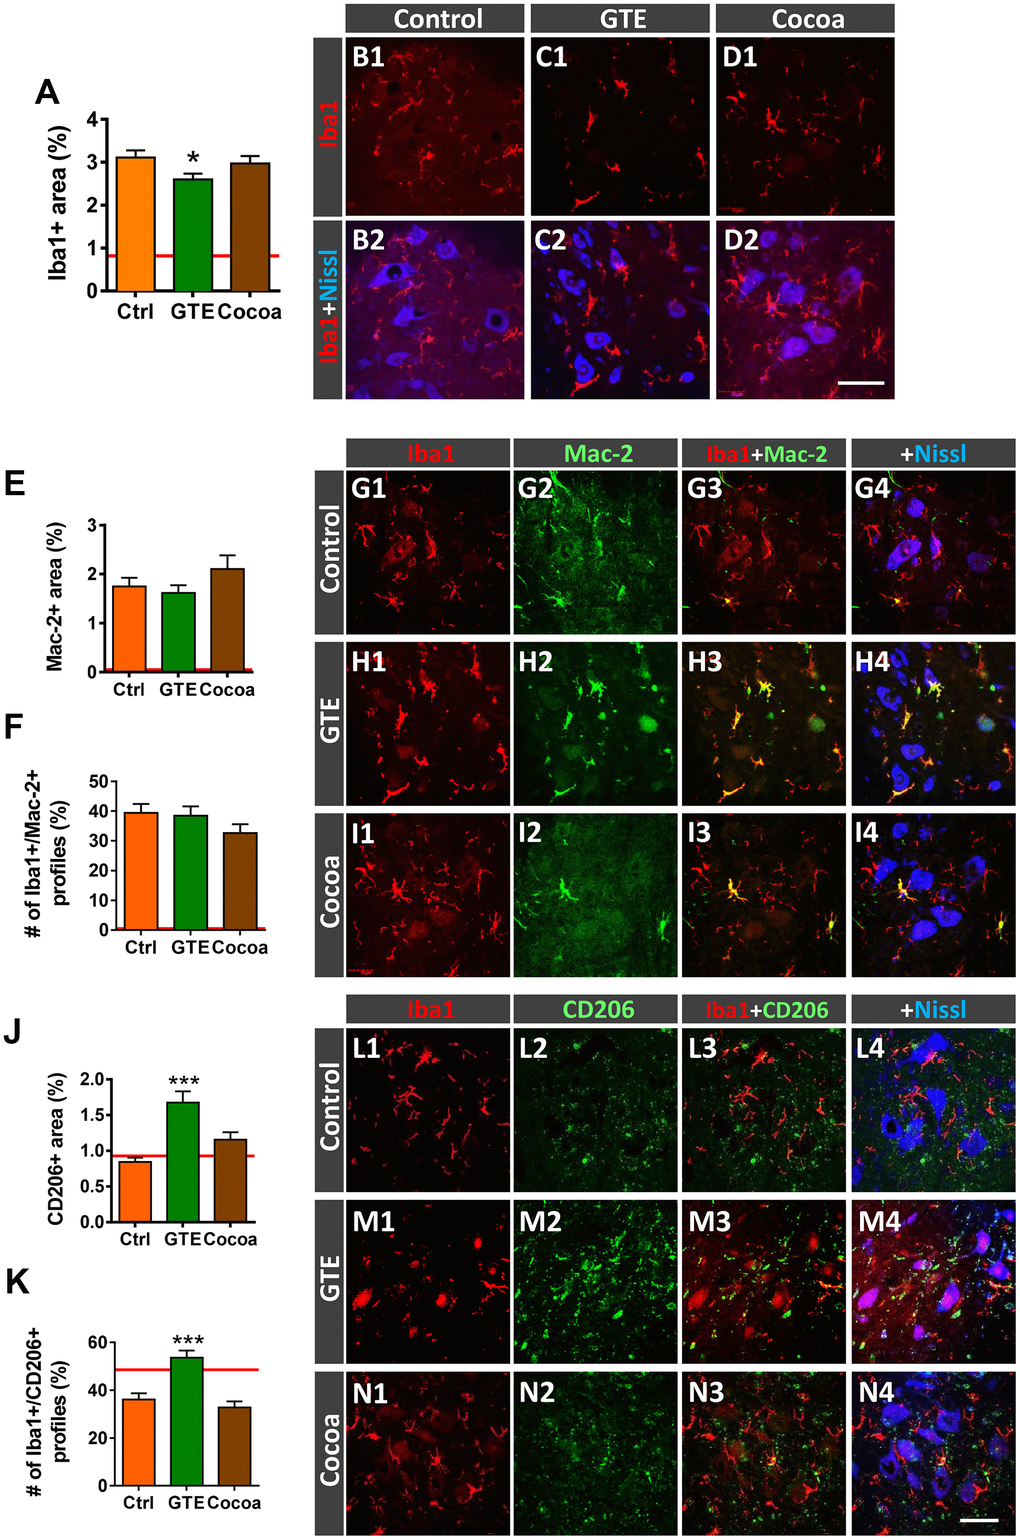
Figure 7.Impact of GTE- and cocoa-supplemented diets on the aging-associated microgliosis and imbalance in M1/M2 microglial phenotypes found in the ventral horn spinal cord of old mice. Lumbar spinal cord sections were immunostained for the microglial marker Iba1 (red), and either Mac-2 or CD206 (green), for M1 or M2 microglia, respectively; fluorescent Nissl staining (blue) was used for MN visualization. (A) Quantification of microglia expressed as the percentage of ventral horn occupied by Iba1-positive profiles. (B1–D2) Representative confocal images showing Iba1-staining around spinal cord MNs of animals from control, GTE and cocoa groups as indicated in panels. (E, F, J, K) Quantification of Mac-2-positive (E) and CD206-positive (J) profiles surrounding MNs shown as the percentage of ventral horn area occupied by the immunostained profiles; the proportion of microglial profiles expressing both Iba1 and either Mac-2 (F) or CD206 (K) is also shown. The average values of these parameters in adult mice from our previous study [6] are indicated in each graph (red lines) for comparison purposes. (G1–I4, L1–N4) Representative confocal micrographs used for data analysis showing Mac-2 (G1–I4) and CD206 (L1–N4) in combination with Iba1 and fluorescent Nissl staining, as indicated in panels. Data in the graphs are expressed as the mean ± SEM; a total of 45-50 images per experimental group were analyzed (number of animals per group: control [Ctrl] = 3, GTE = 4, cocoa = 5); *p < 0.05 and ***p < 0.001 vs. Ctrl (one-way ANOVA, Bonferroni's post hoc test). Scale bar in N4 = 50 μm (valid for B1–D1, G1–I4, L1–N3).
Figure 7 — Beneficial effects of dietary supplementation with green tea catechins and cocoa flavanols on aging-related regressive changes in the mouse neuromuscular system | Aging