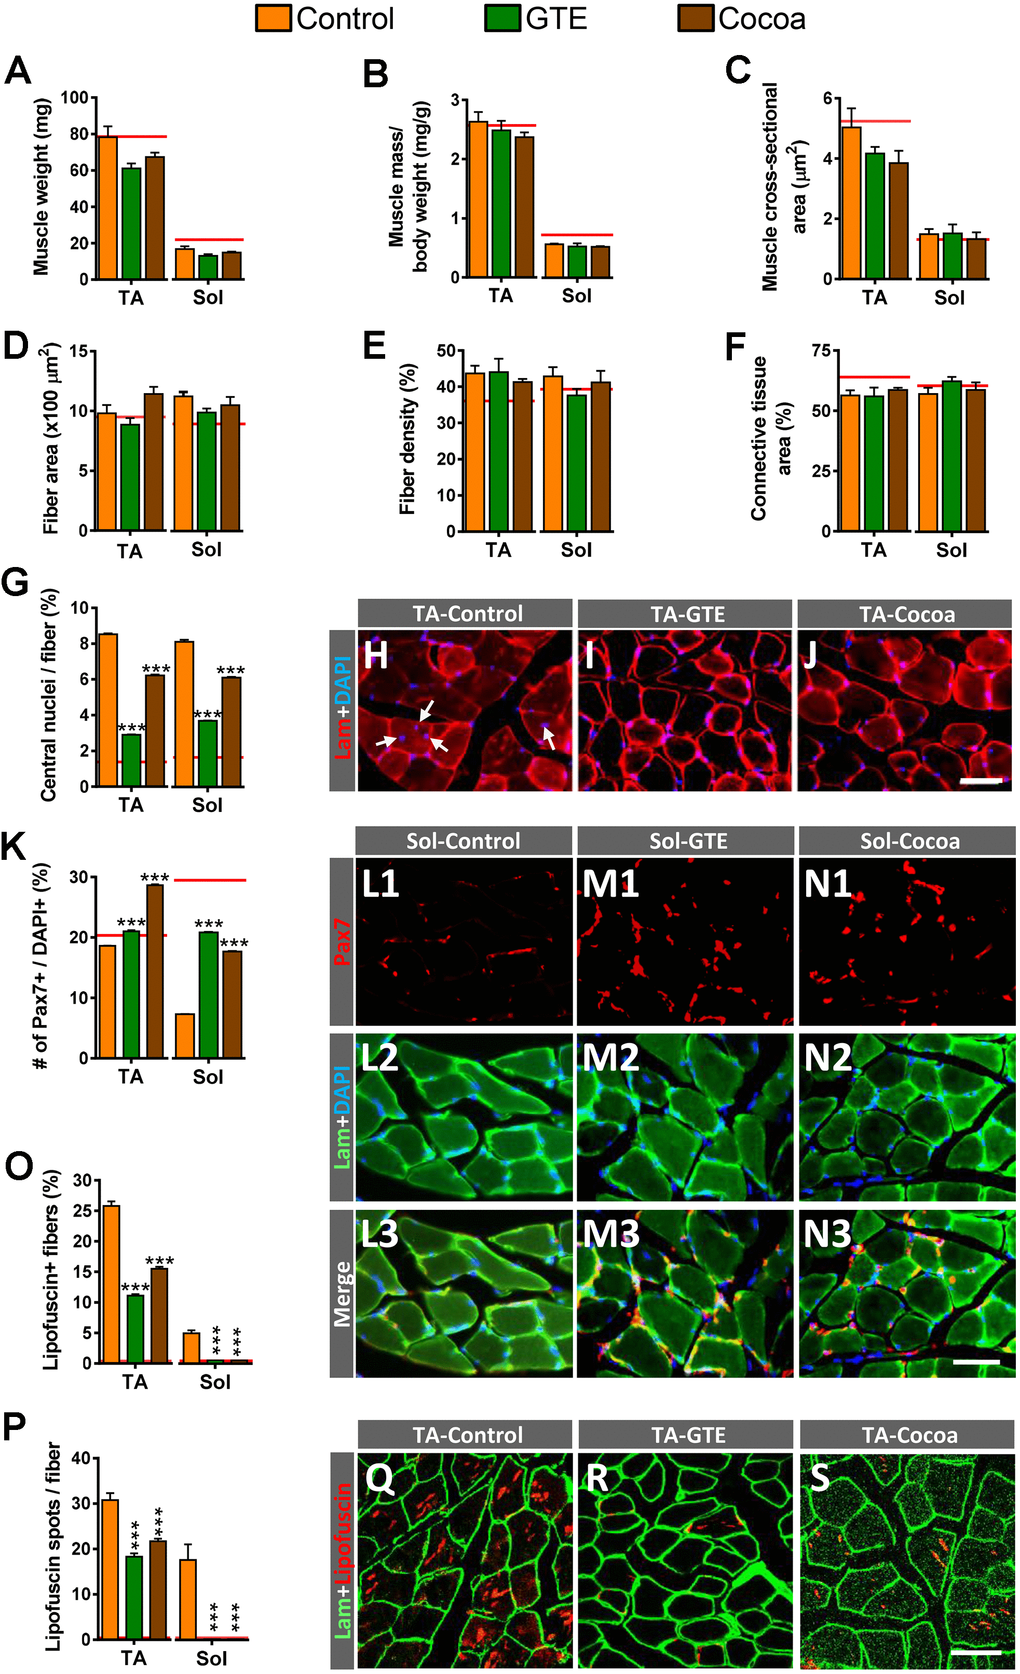
Figure 2.Impact of GTE- and cocoa-supplemented diets on aging-associated changes in TA and Sol muscles of mice. (A–C) Muscle wet weight (in mg, A), muscle weight relative to body weight (expressed in mg/g, B) and muscle cross-sectional area (in μm2, C) are shown. (D) Average myofiber size (cross-sectional area in μm2). (E, F) Density of myofibers (E) and muscular content of connective tissue (F), expressed as the percentage of area occupied by either myofibers or connective tissue respect to the total cross-sectional muscle area). (G) Proportion of myofibers displaying central nuclei. (H–J) Representative images of transversal cryosections of TA muscles of control, GTE and cocoa groups (as indicated); sections were double labeled with an antibody against laminin (red) and DAPI (blue) for DNA; arrows in (H) indicate central nuclei. (K) Percentage of Pax7-immunostained cells (SCs) with respect to DAPI-positive nuclei. (L1–N3) Representative images of a combined immunolabeling for Pax7 (red) and laminin (green), and DAPI staining (blue) in transversal cryosections of Sol muscles from control, GTE and cocoa groups, as indicated. (O, P) Percentage of myofibers containing lipofuscin aggregates (O), and average number of lipofuscin granules per myofiber (P). (Q–S) Representative images of transversal cryosections of TA muscles from control, GTE and cocoa groups (as indicated) immunolabeled for laminin (green); lipofuscin autofluorescence (red) was excited using 510-560 nm excitation and 590 emission filters. Data in graphs are expressed as the mean ± SEM; the average values of adult muscles found in a previous study [6] were indicated by a red line in each graph for comparative purposes; ***p < 0.001 vs. control (Ctrl), two-way ANOVA, Bonferroni’s post hoc test; sample size per condition: (A–C) = 6-12 muscles and (D–F) = 3-5 muscles from different mice; (G, K) = 2500-4000 fibers and (O, P) = 1200-2200 fibers per muscle from 3-5 animals. Scale bars: 40 μm in (J) (valid for H, I), in N3 (valid for L1–N2) and S (valid for Q, R).
Figure 2 — Beneficial effects of dietary supplementation with green tea catechins and cocoa flavanols on aging-related regressive changes in the mouse neuromuscular system | Aging