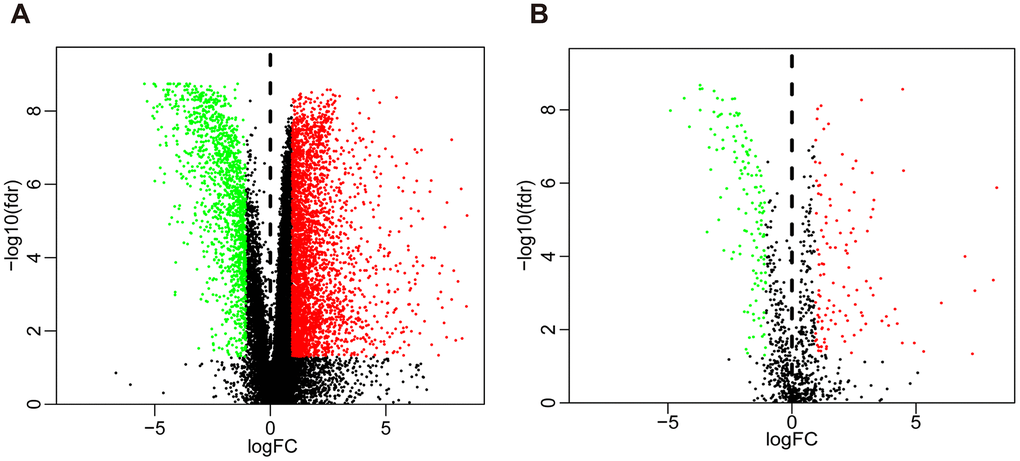
Figure 1.Volcano plot of differentially expressed genes and immune-related genes. (A) Volcano plot of differentially expressed genes between bladder cancer (BLCA) and non-tumor tissues. (B) Volcano plot of differentially expressed immune-related genes between bladder cancer (BLCA) and non-tumor tissues. The green dots represent downregulated genes, the red dots represent upregulated genes, and the black dots represent genes that were not significantly differentially expressed.