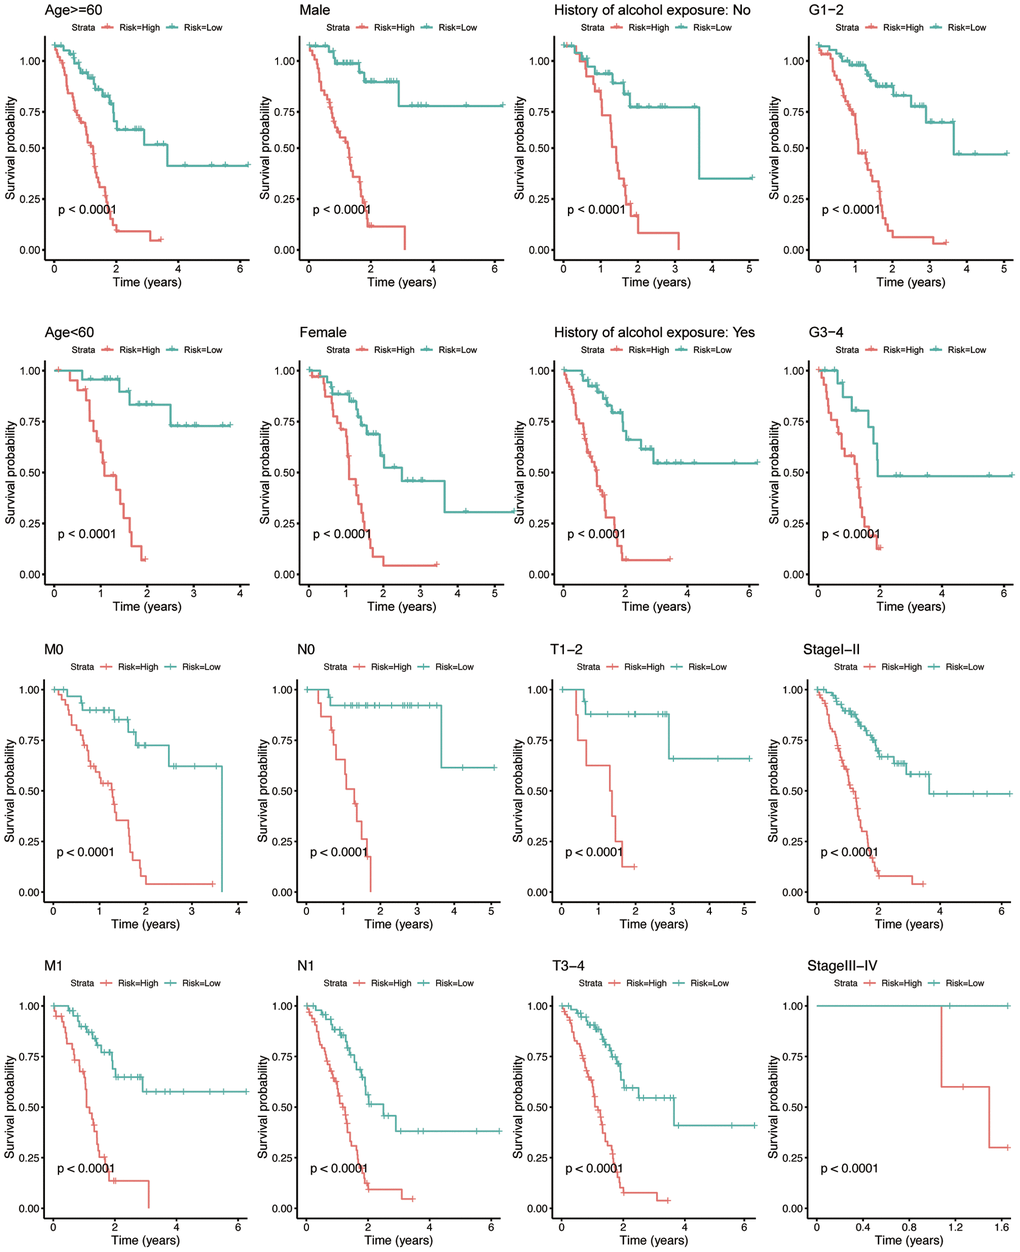
Figure 3.Kaplan-Meier analysis for PAAD patients between subgroups according to clinicopathological features, including age, gender, history of alcohol exposure, grade, M-, N-, T- classification, and AJCC stage. The X-axis indicates the time in years. The red curve represents the high-risk group, and the blue curve represents the low-risk group.