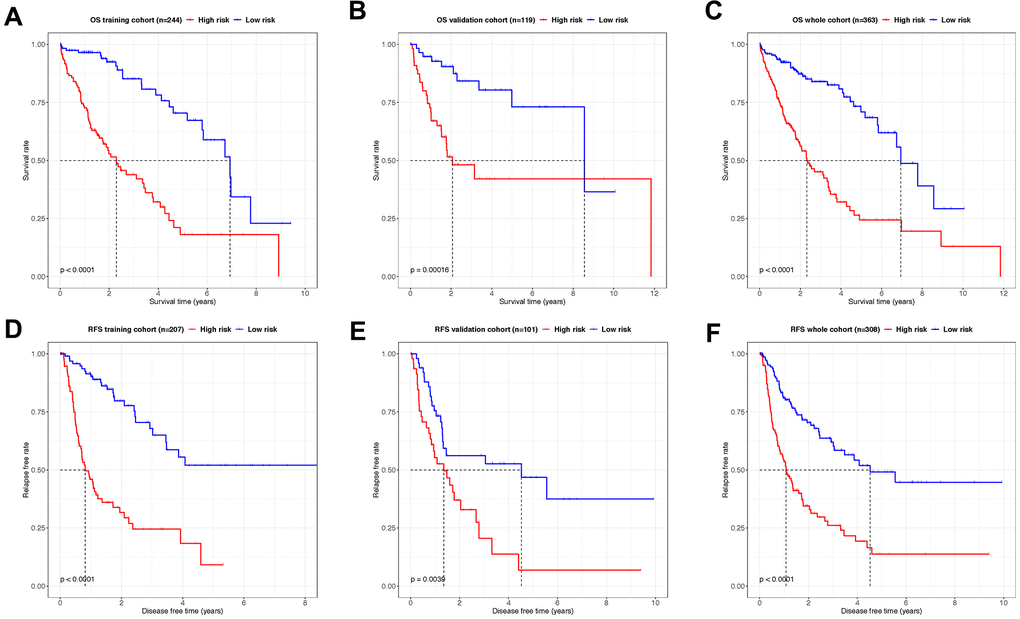
Figure 5.Kaplan–Meier analysis showing the OS- and RFS-time expectancy. (A–C) The overall survival curves of HCC patients in training, validation and whole cohorts grouped by the risk level. (D–F) The relapse-free survival curves of HCC patients in training, validation and whole cohorts grouped by the risk level.