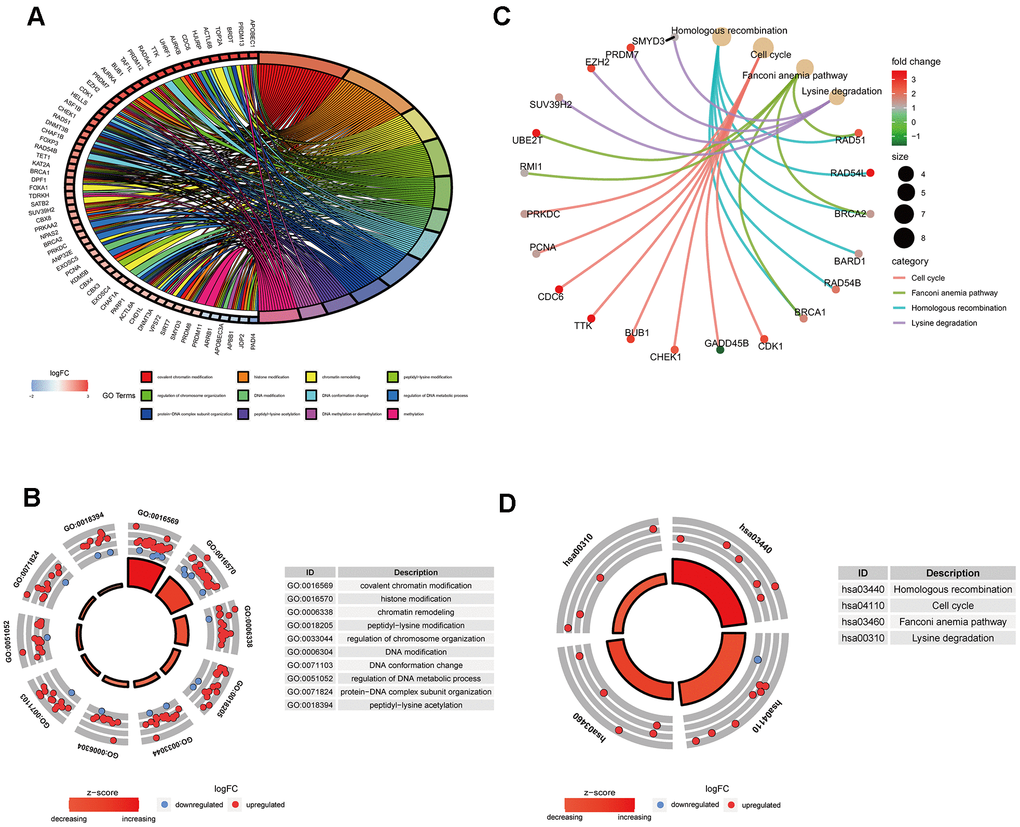
Figure 2.Gene functional enrichment analysis of differentially expressed ERGs. (A) The top 12 significant terms of GO function enrichment. (B) The GO circle shows the scatter map of the logFC of the specified gene. (C) The correlation between intersection genes and the significant terms of KEGG. (D) The KEGG circle shows the scatter map of the logFC of the specified gene. The higher the Z-score value indicated, the higher expression of the enriched pathway.