Submit an Article
Navigate
Home
Editorial Board
Editorial Policies
Current Volume
Archive
Scientific Integrity
Publication Ethics Statements
Interviews with Outstanding Authors
Newsroom
Sponsored Conferences
Podcast
Contact
Special Collections
Submit an Article
Online ISSN: 1945-4589
Research Paper
|
Volume 13, Issue 14
|
pp. 18701–18717
Development and validation of a novel epigenetic-related prognostic signature and candidate drugs for patients with lung adenocarcinoma
Back to article
Figure 10
(10 of 13)
−
100%
+
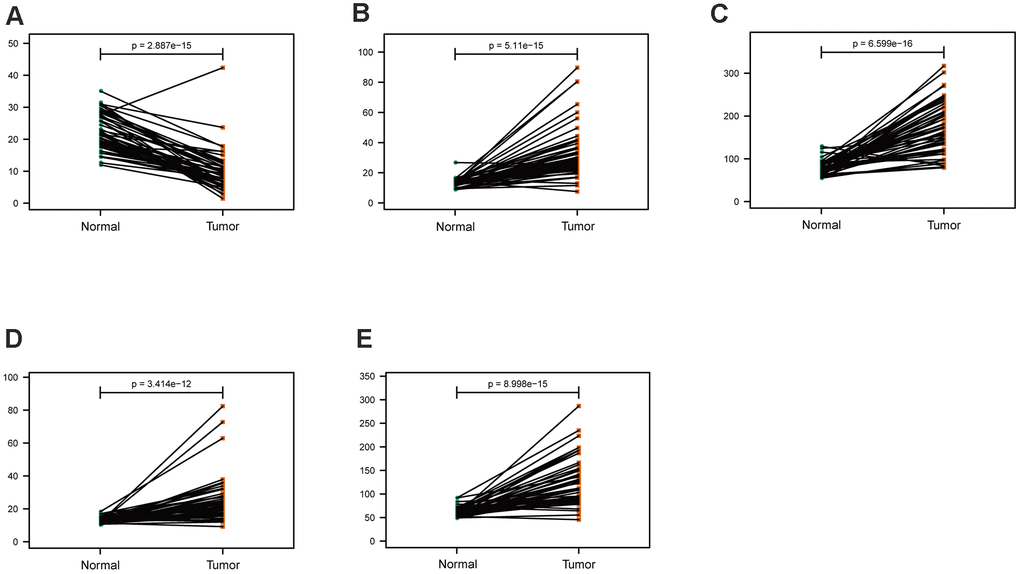
Figure 10.
Comparison of the hub genes mRNA levels in paired adjacent normal tissues and LUAD tissues from the TCGA cohort.
(
A
) ARRB1, (
B
) PARP1, (
C
) PKM, (
D
) TFDP1, (
E
) YWHAZ.