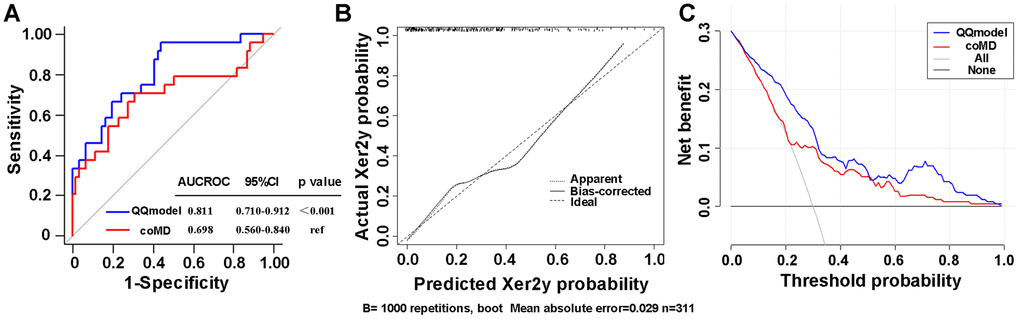
Figure 3.(A) ROC curves comparing the sensitivity and specificity of the coMD and nomogram (B) Calibration plots of the nomogram for Xer2y incidence prediction. X-axis indicates the predicted probabilities with Xer2y while y-axis shows the actual events. The ideal prediction will correlate when slope equals to 1 (the black broken line in the figure). (C) Decision curves of two risk models for Xer2y incident prediction. The horizontal axis represents the risk threshold while the vertical-axis denotes standardized net benefit. The solid black line is the net benefit when no patients have Xer2y while the dash gray line suggests the net benefits where patients have Xer2y at a certain risk threshold. The red and blue curves imply the results of the Xer2y on the basis of coMD and nomogram, respectively. AUCROC (area under the receiver operating characteristic curve). 95% CI (95% confidence interval).