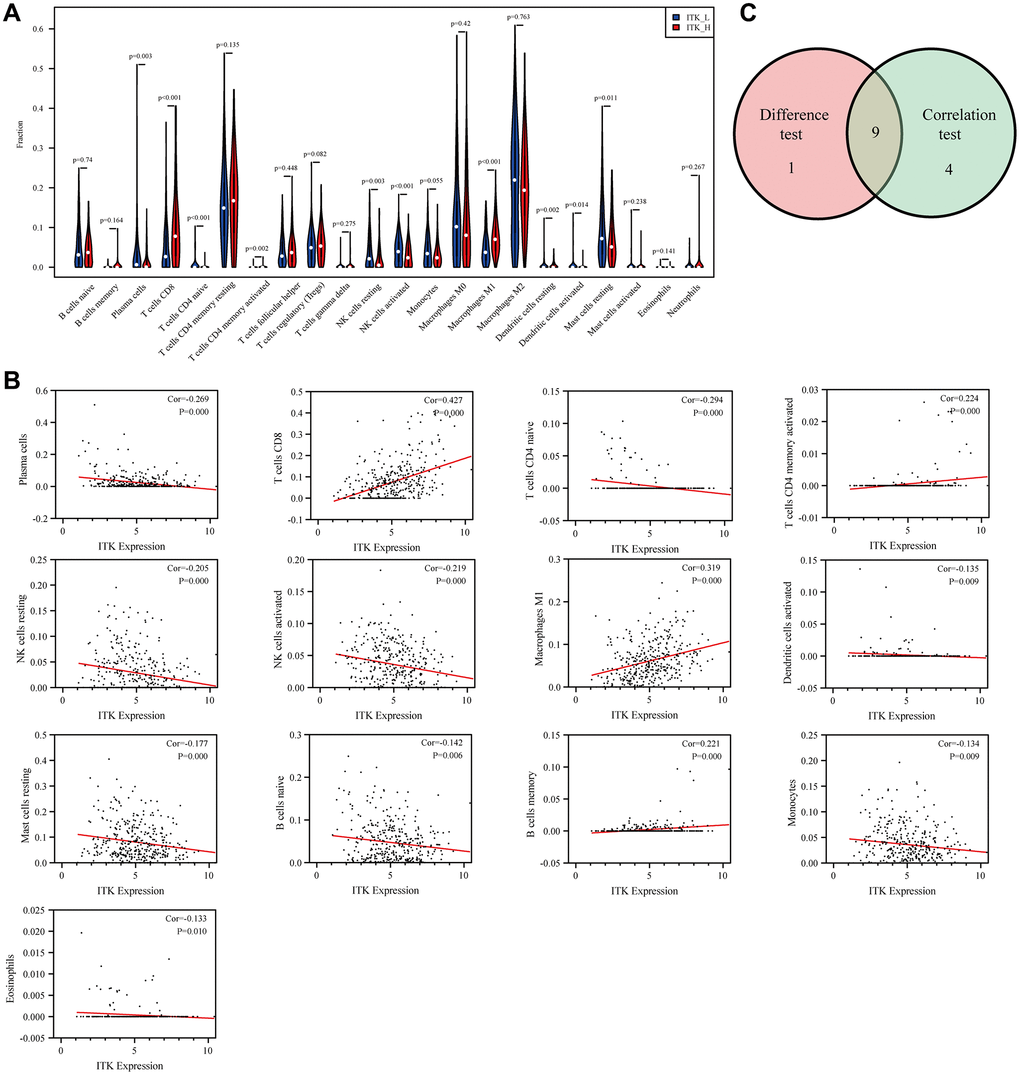
Figure 10.The correlation between ITK expression and TICs proportion. (A) The distributions of 22 kinds of TICs in low/high ITK subgroups are shown in a violin plot. (B) Scatter plots of the 13 kinds of TICs significantly correlated with ITK expression (p < 0.05). (C) Venn diagram showing nine common TICs shared, as assessed using differential analysis and correlation analysis.