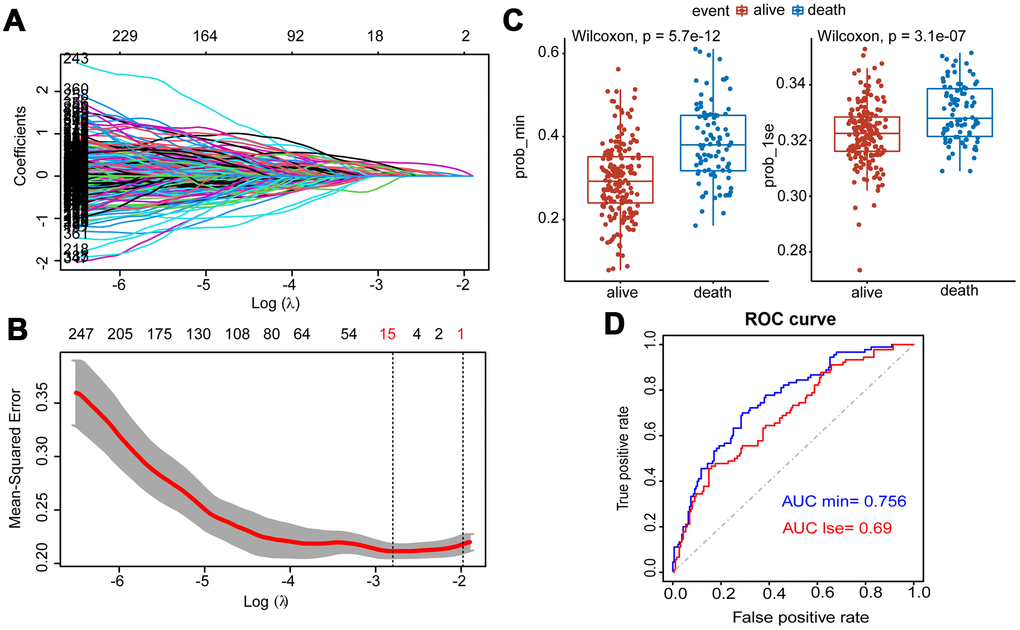
Figure 3.Construction of Lasso Cox regression model using training dataset of MM. (A) A coefficient profile plot was produced against the log (λ) sequence. (B) Tuning parameter (λ) selection in the Lasso model used 10-fold cross-validation via minimum criteria. Dotted vertical lines were drawn at the optimal values by using the minimum criteria and the 1 standard error of the minimum criteria (the 1-SE criteria). (C) Survival probabilities (Prob-min and Prob-lse) were predicted by two Lasso models based on two ideal parameters Log λ.lse and Log λ.min. The Wilcoxon test was used to compare the different survival outcomes. (D) ROC curves analysis and the values of AUC were used to compare two Lasso models based on Log λlse and Log λmin.