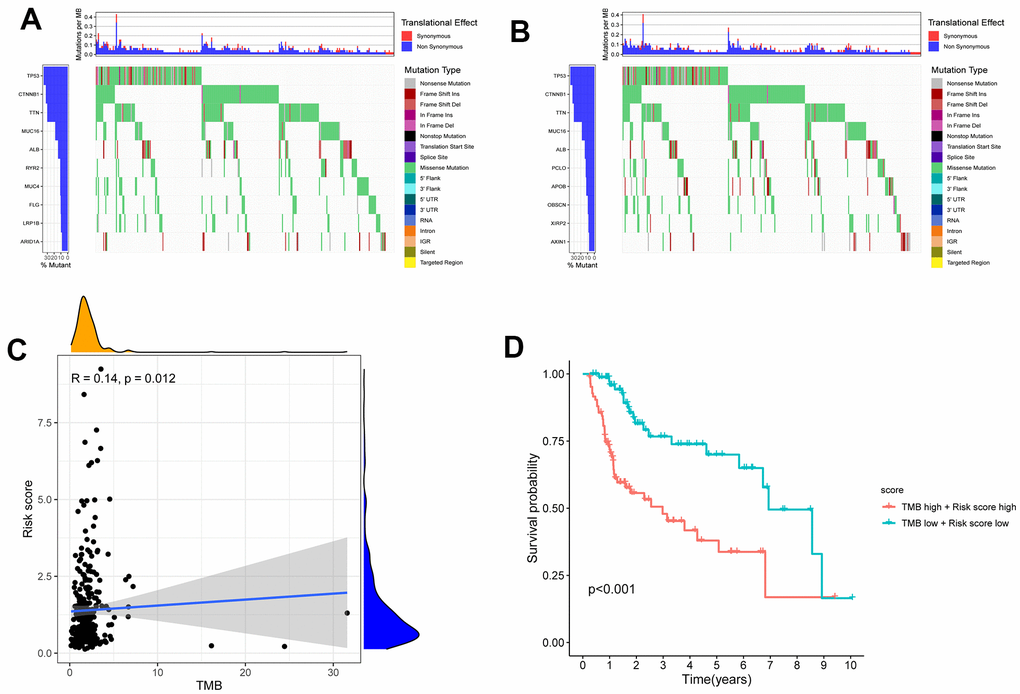
Figure 9.The differences of TMB in high and low risk HCC patients. (A) The TMB in high risk HCC patients. (B) The TMB in low risk HCC patients. (C) The TMB was positively correlated with the risk score in patients with HCC. (D) The OS of the HCC patients of high risk and high TMB were lower than those in HCC patients with low risk and low TMB.