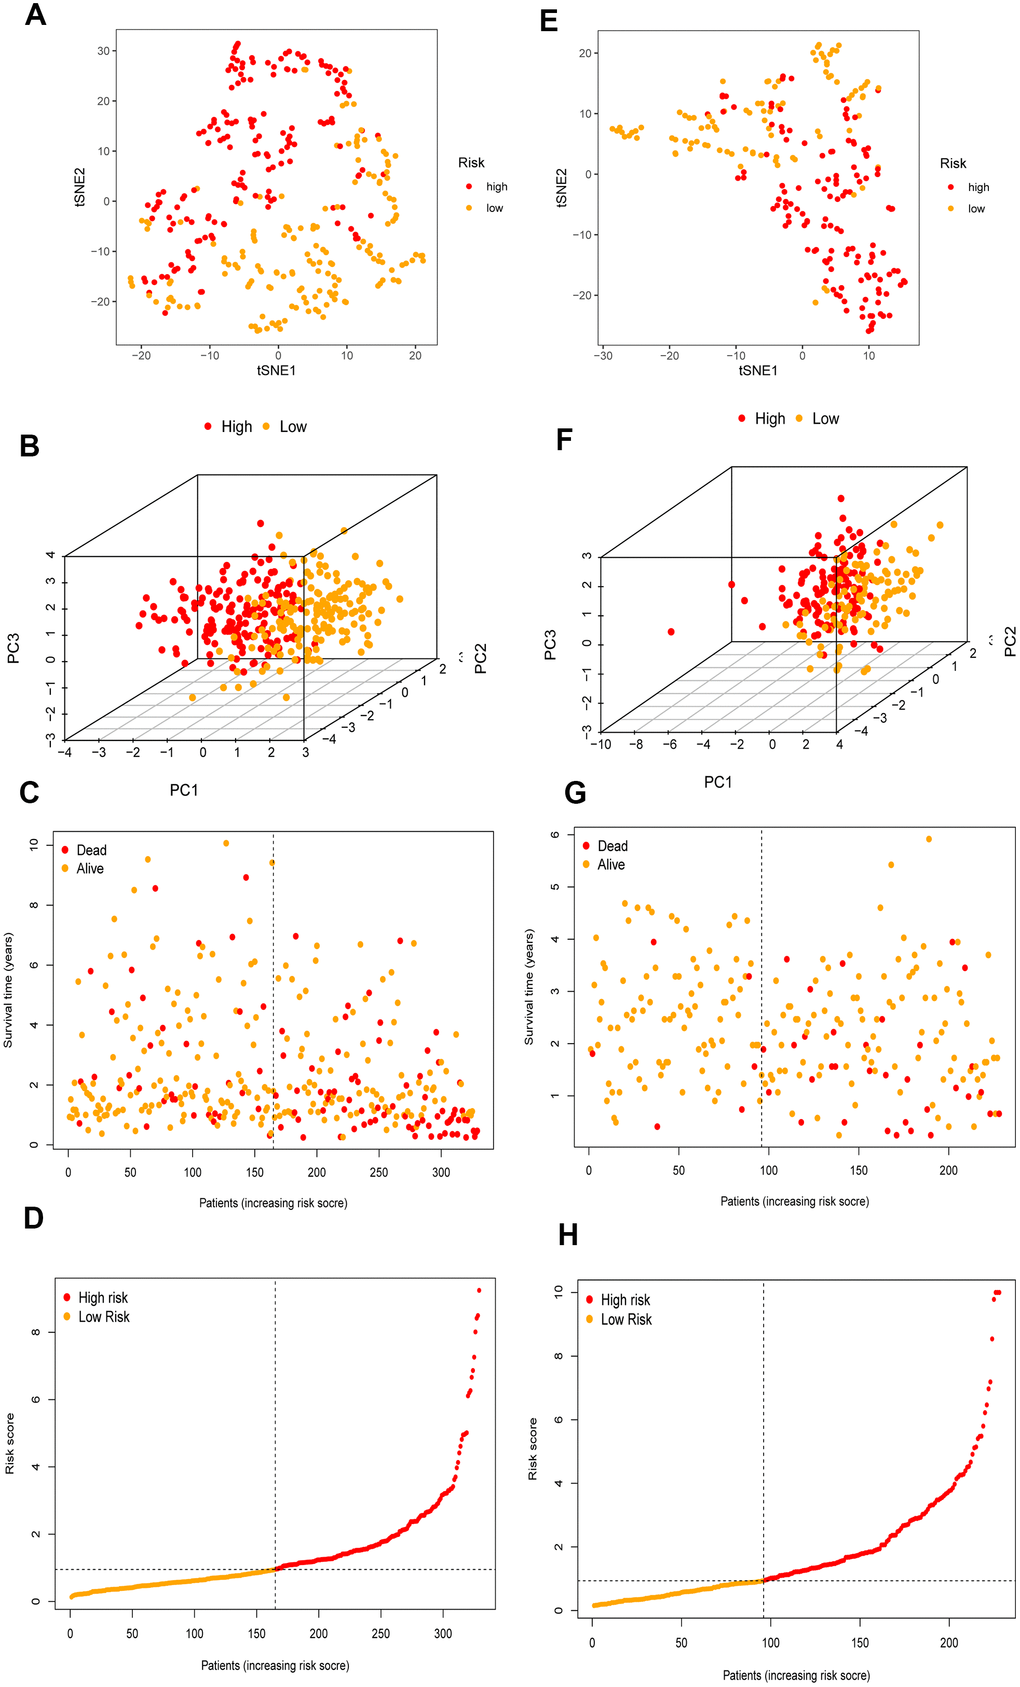
Figure 5.The validation of the risk prognostic model in HCC patients. (A–D) t-SNE, PCA, survival status scatter plots and risk score distribution shown the power prognostic ability of the risk prognostic model in TCGA. (E–H) t-SNE, PCA, survival status scatter plots and risk score distribution shown the power prognostic ability of the risk prognostic model in ICGC.