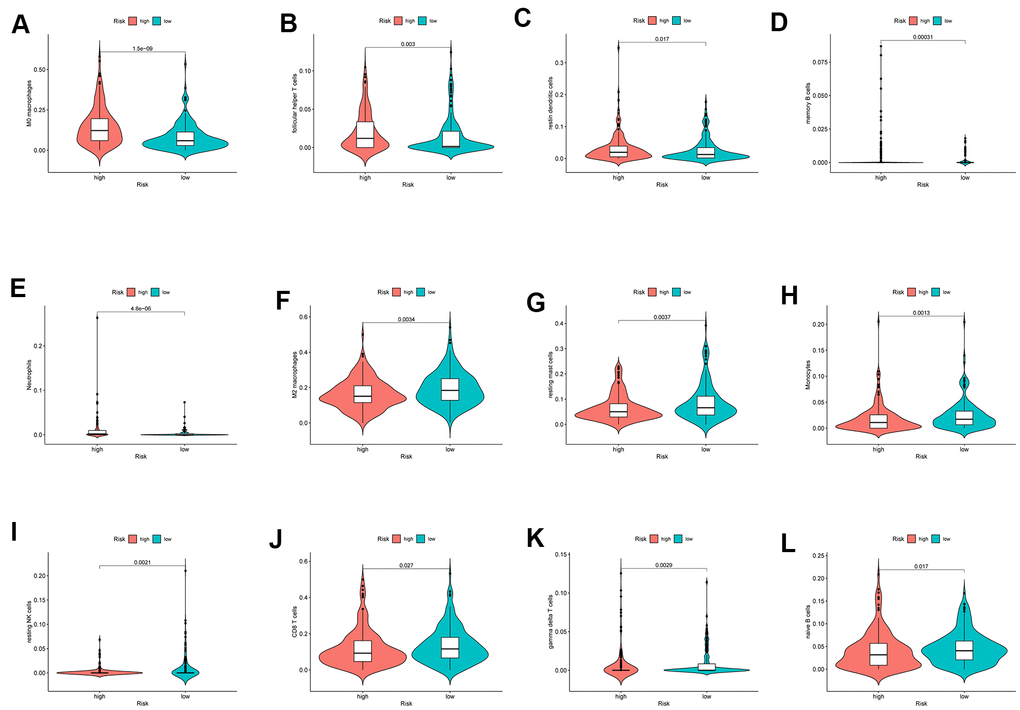
Figure 11.The different immune infiltration in the high and low risk HCC patients. (A–E) The expression of five types of immune cells is higher in high risk group compared with low risk group. (F–L) The expression of seven types of immune cells is higher in low risk group compared with high risk patients.