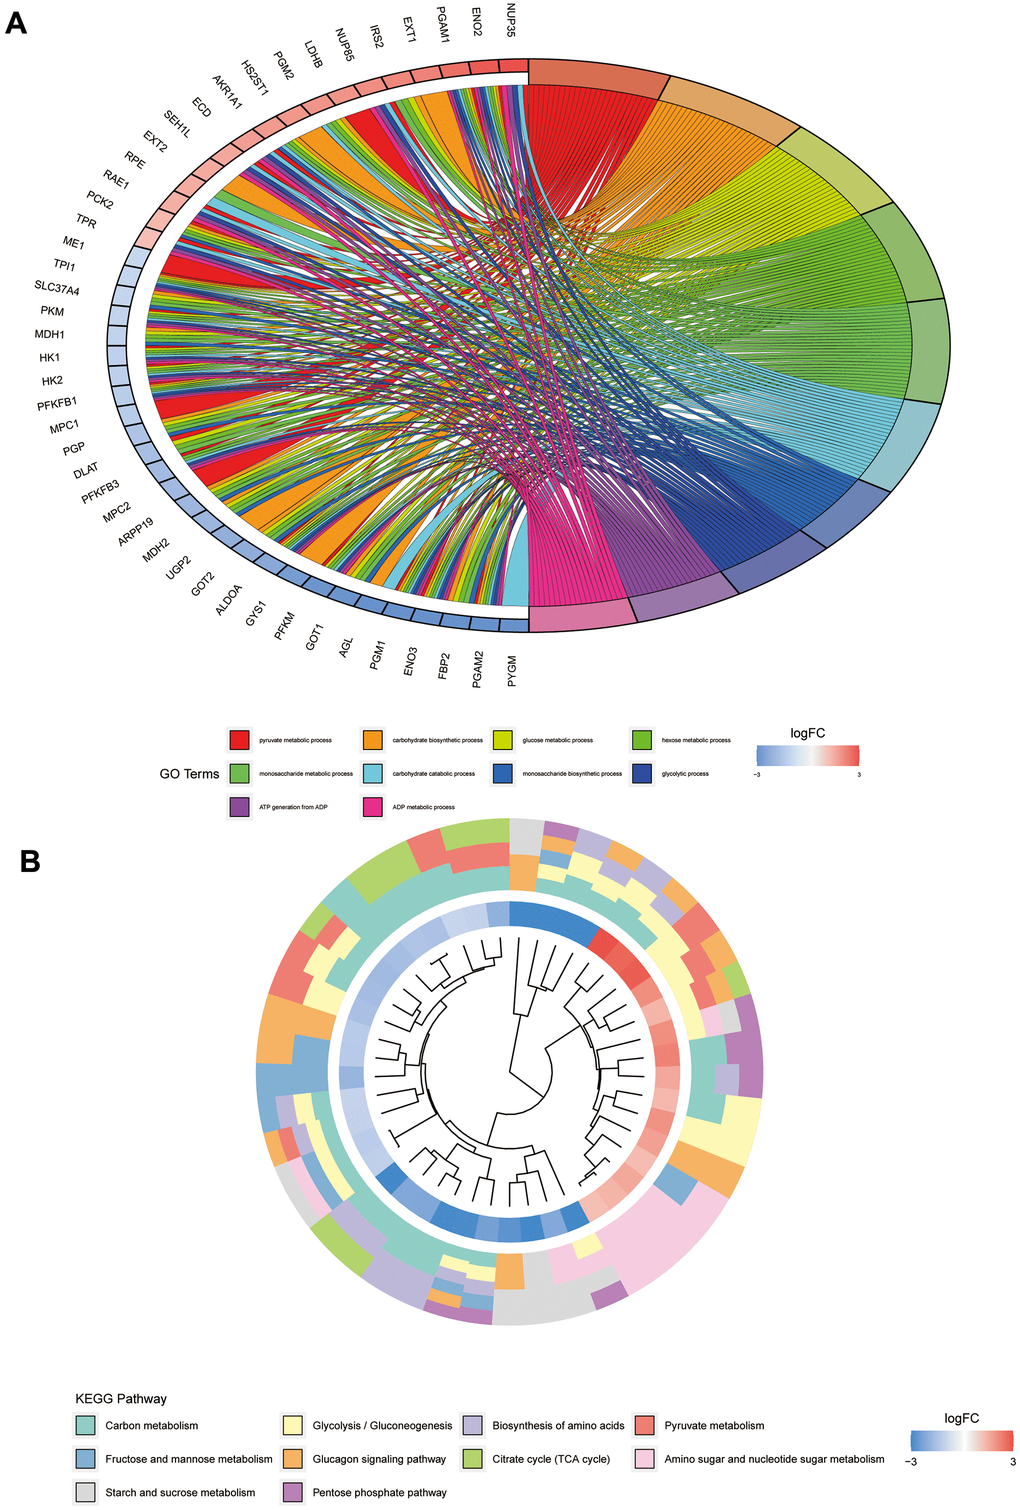
Figure 4.GO and KEGG pathway analyses of glycolysis-related genes. (A) Represents the GO pathway analysis; each colour represents a GO entry, and the top 10 GO entries are shown. (B) Represents the KEGG pathway analysis; each colour represents a pathway, and the innermost layer represents the size of the logFC value of the gene.