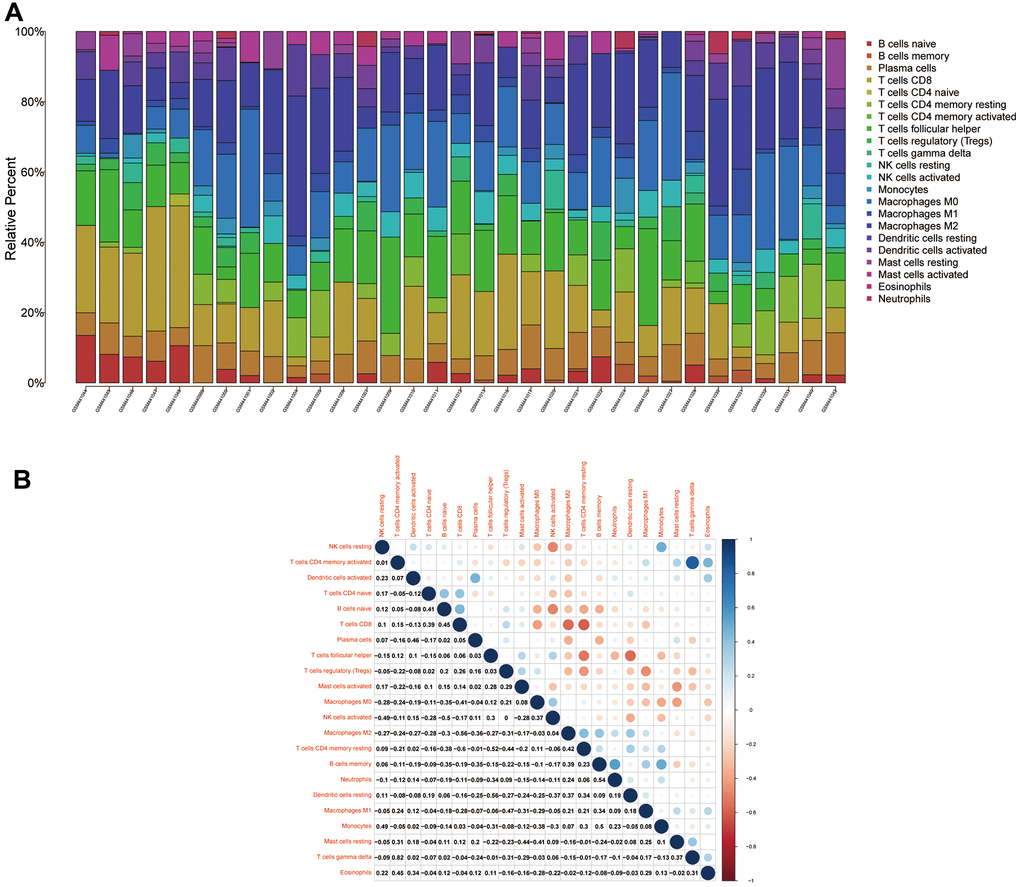
Figure 11.Immune cell compositions and correlation heat map. (A) Plot showing the composition of immune cells for each sample. (B) Plot showing the correlation heat map between each immune cells. Red indicates positivity correlation and blue indicates negative correlation.