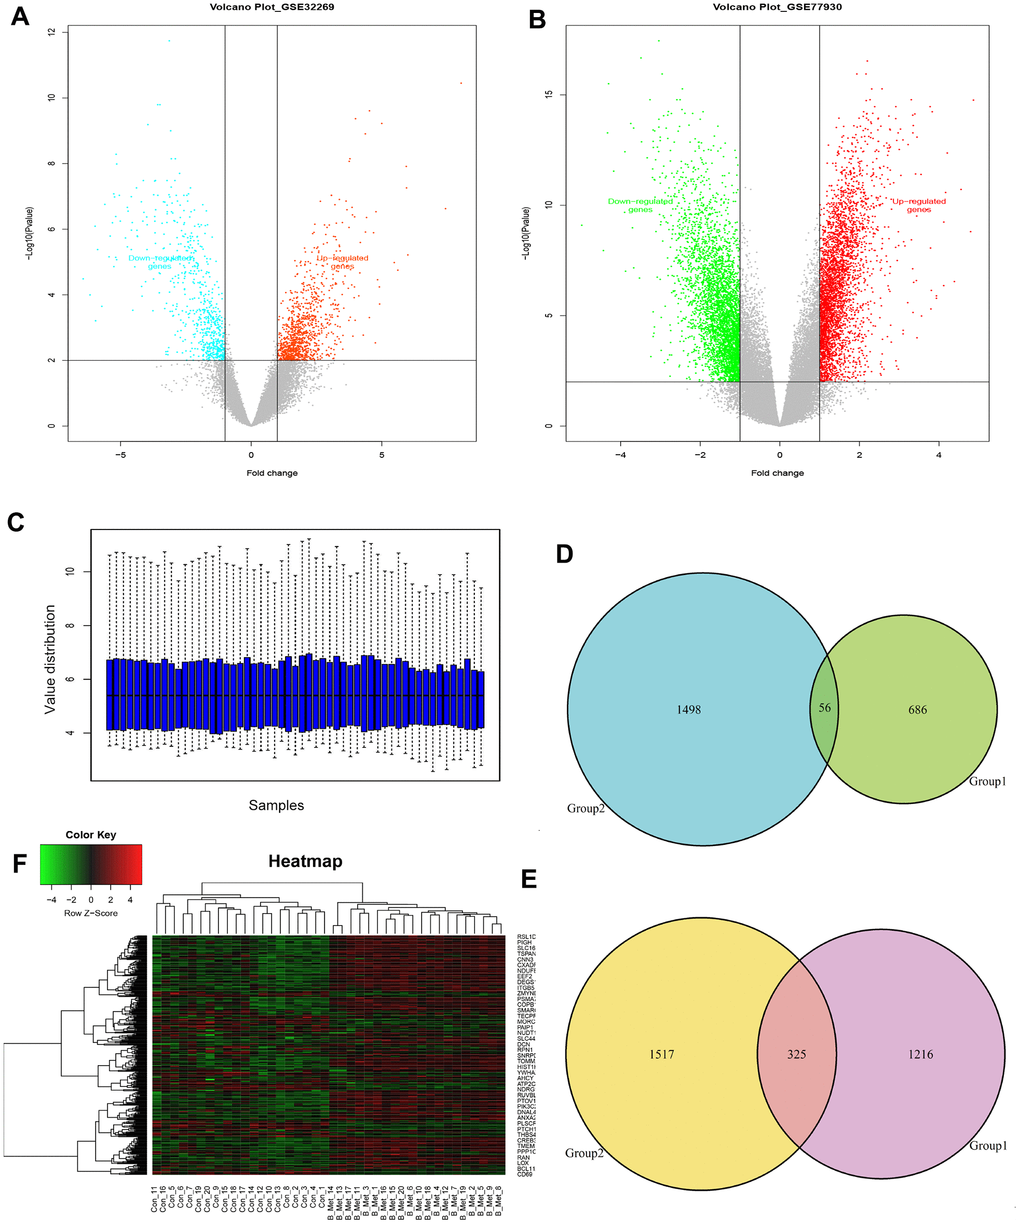
Figure 1.Identification of the overlapping DEGs in GSE32269 and GSE77930. Volcano plots of DEGs from analyzed microarray data of GSE32269 (A) and GSE77930 (B). (C) The gene expression distribution after normalization. Venn plots for the overlapping downregulated (D) and upregulated (E) DEGs. (F) The dendrogram of overlapping DEGs. Red represents higher expression and green represents lower expression. The criteria used to select DEGs were P <0.05 and |log2 (fold-change)| >1. DEGs, differentially expressed genes.