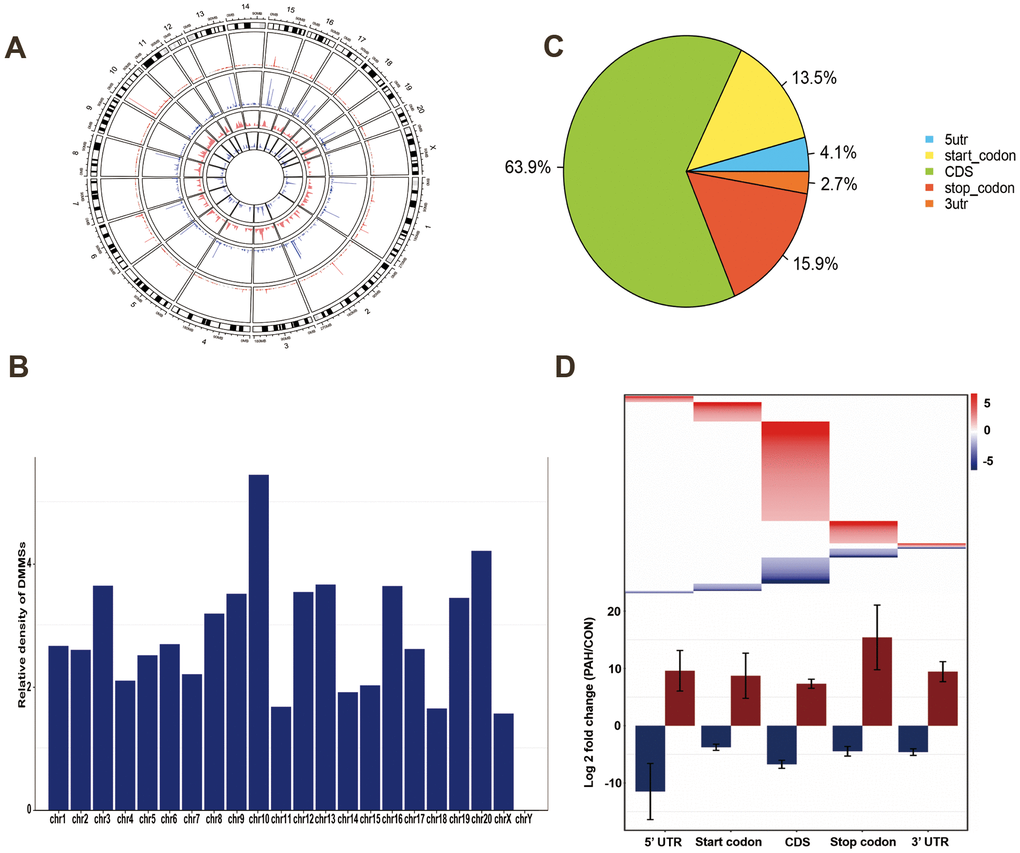
Figure 3.Distribution of differentially methylated N6-methyladenosine sites. (A) Circos plots was used to plot the chromosomal distribution and genomic density of all DMM sites on genome. In the plot, red corresponds to up-methylated sites (gain of methylation) and blue corresponds to down-methylated sites (loss of methylation). Two histogram tracks were closer to the rat genome showed the chromosomal distribution of up-methylated sites and down-methylated sites, respectively. Two genomic density tracks were father from the rat genome showed the genomic density of up-methylated sites and down-methylated sites, respectively. (B) Relative occupancy of differentially methylated m6A sites in each chromosome normalized by length of the respective chromosome. (C) Pie chart showing the percentage of DMM peaks in five non-overlapping segments. Among them the largest proportion is the coding sequence. (D) Statistics of fold change of DMM peaks in five segments. The upper heatmap shows the distribution of the fold change, while the lower histogram shows the mean of the fold change. Error bars represent the standard error of the mean. (DMM: Differentially methylated N6-methyladenosine).