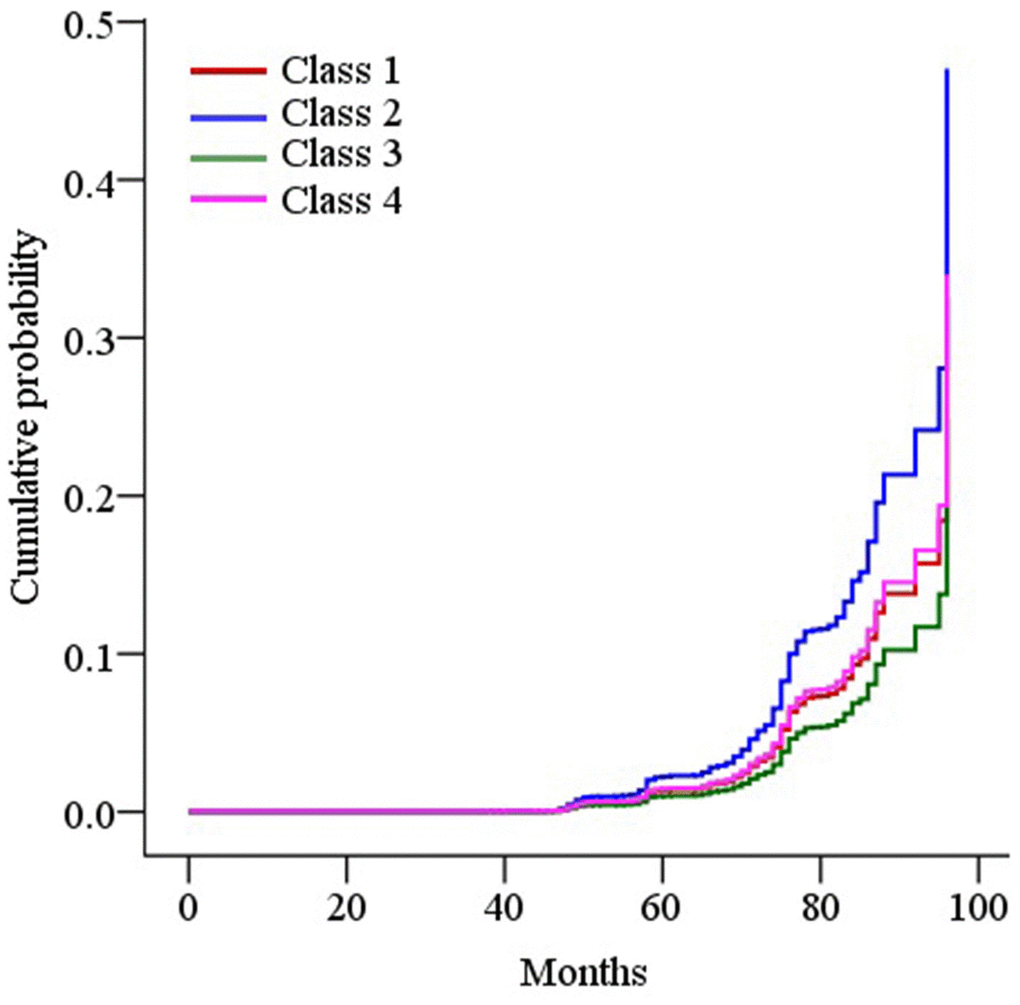
Figure 2.Survival curves of the cumulative incidence of dementia by trajectory classes of systolic blood pressure (SBP) in the final adjusted model. The Cox-proportional hazard model was used to plot the survival curves. Class 1, normal SBP; class 2, stabilized SBP; class 3, elevated SBP; and class 4, persistently high SBP.