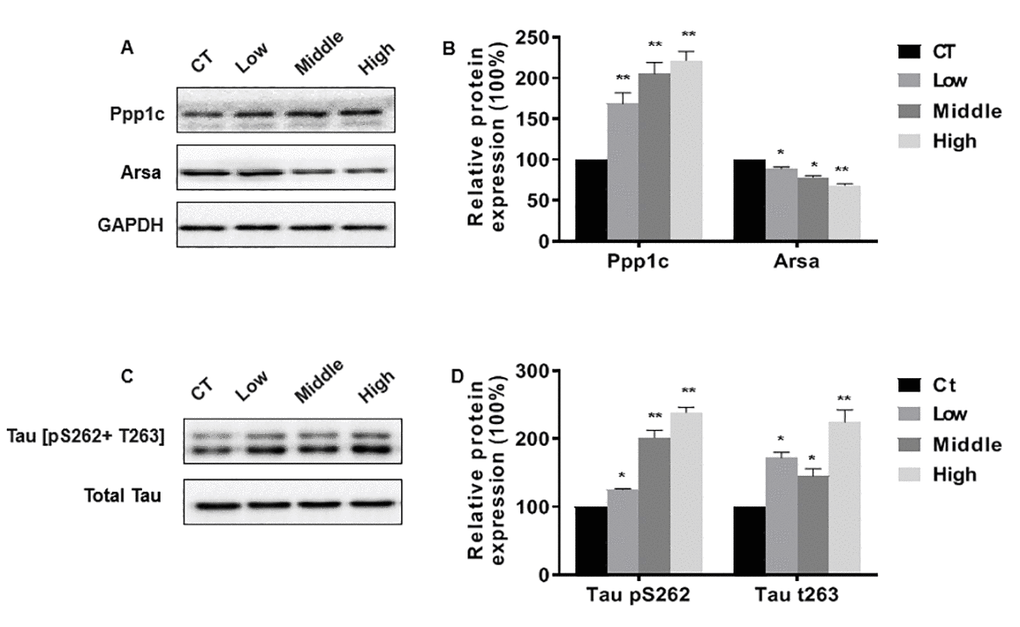
Figure 7.Confirmation of differentially expressed protein. (A–C) Western blots were performed, and (B–D) relative protein levels of Ppp1c, Arsa and tau[pS262+ T263] were measured. Blots were quantified by densitometry and normalized by use of GAPDH or Total Tau to correct for differences in loading of proteins. The graphed results depict the mean {plus minus} SEM. *P < 0.05, **P < 0.01 versus the control mice (n = 6 for each group).