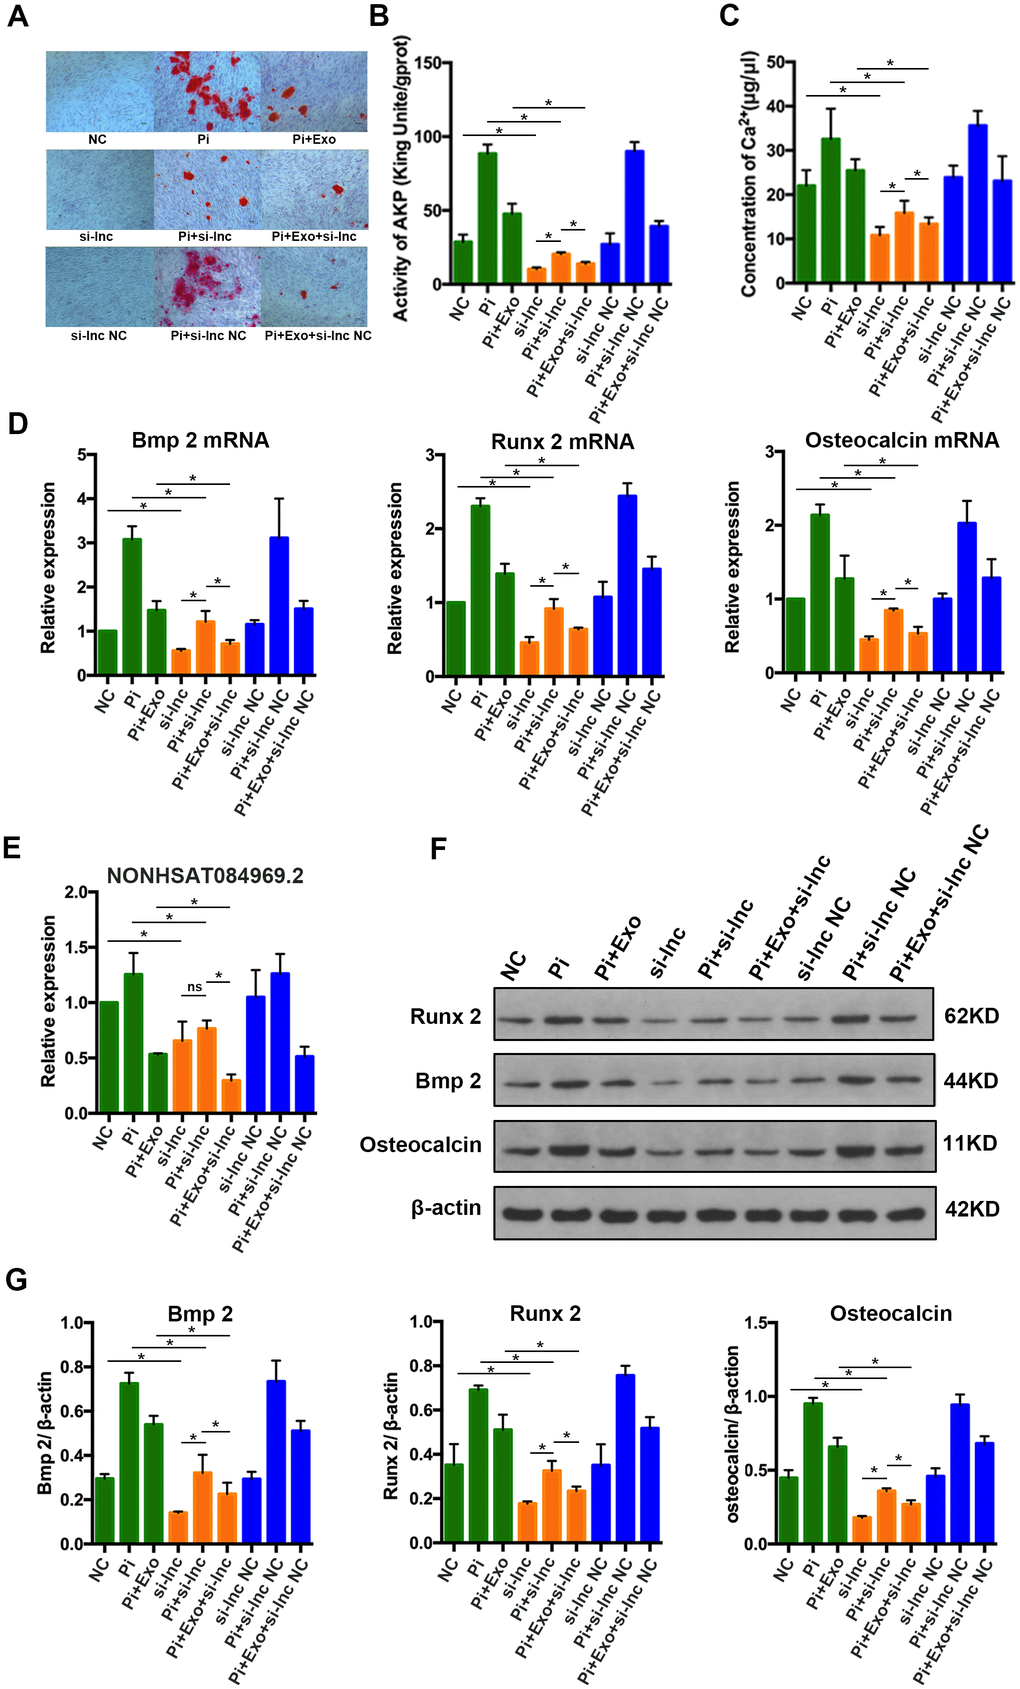
Figure 8.(A) Alizarin Red S staining. (B, C) Determination of AKP activity and Ca2+ concentration in each group. (D) RT-qPCR analysis of mRNAs associated with osteogenic transdifferentiation. (E) RT-qPCR analysis of NONHSAT 084969.2. (F, G) Western blot analysis of protein expression. *P<0.05.