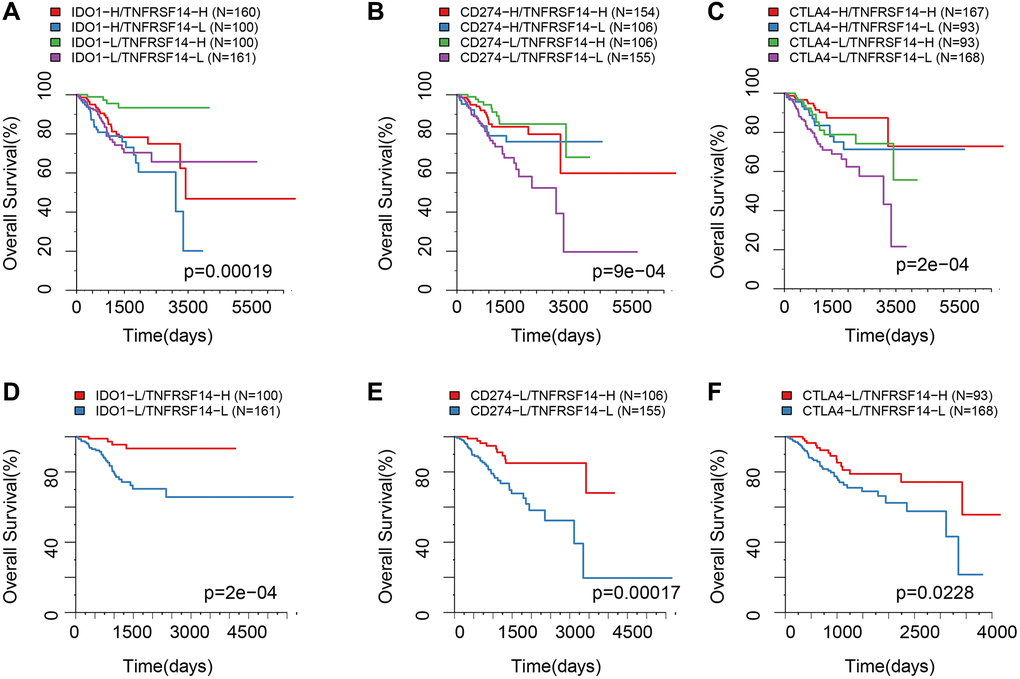
Figure 9.Survival analysis of EC patients belonging to different ICG expression subgroups. (A) Kaplan-Meier survival curves show OS of EC patients belonging to high or low IDO1 and TNFRSF14 expression groups. (B) Kaplan-Meier survival curves show OS of EC patients belonging to high or low CD274 and TNFRSF14 expression groups. (C) Kaplan-Meier survival curves show OS of EC patients belonging to high or low CTLA4 and TNFRSF14 expression groups. (D) Kaplan-Meier survival curves show OS of EC patients belonging to IDO1lowTNFRSF14high and IDO1lowTNFRSF14low expression groups. (E) Kaplan-Meier survival curves show OS of EC patients belonging to CD274lowTNFRSF14high and CD274lowTNFRSF14low expression groups. (F) Kaplan-Meier survival curves show OS of EC patients belonging to CTLA4lowTNFRSF14high and CTLA4lowTNFRSF14low expression groups. The abscissa represents survival time, and the ordinate represents overall survival.