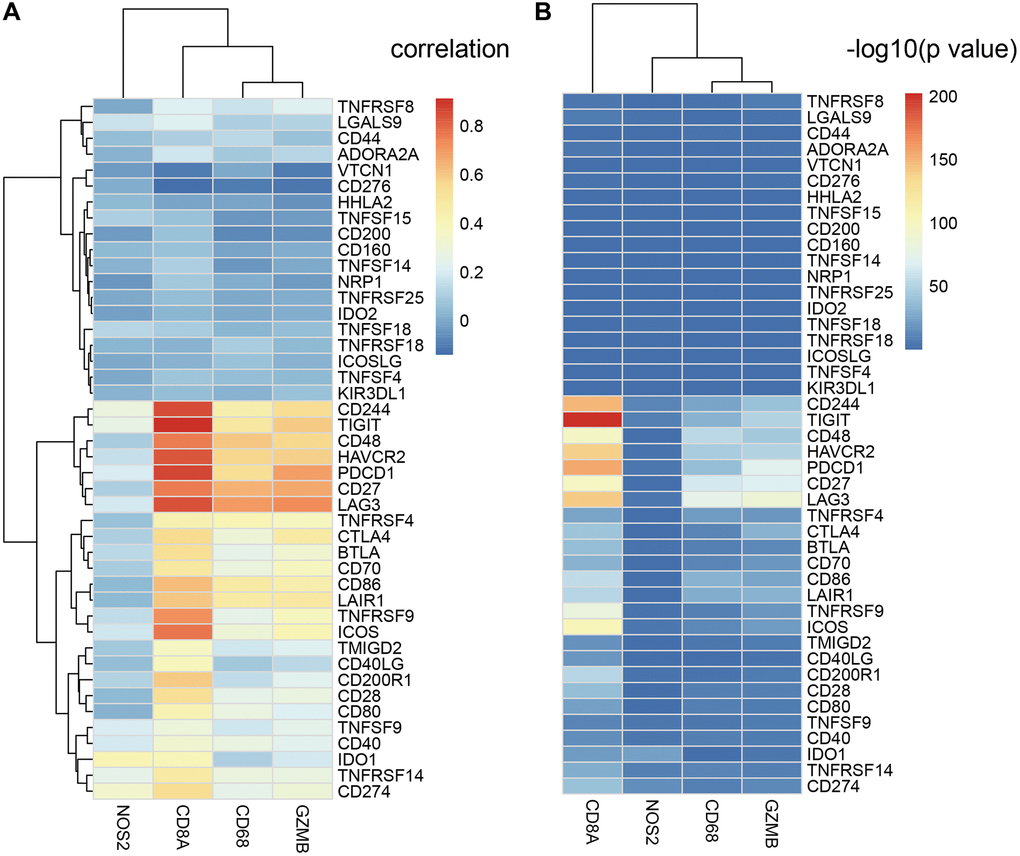
Figure 7.Relationship between ICGs and adaptive immune resistance pathway genes in EC. (A) Heat map shows correlation coefficients of ICGs and adaptive immune resistance pathway genes. (B) P-values for the correlation coefficients show the significance of the association between ICGs and adaptive immune resistance pathway genes. The -log10P-values are plotted along the x-axes.