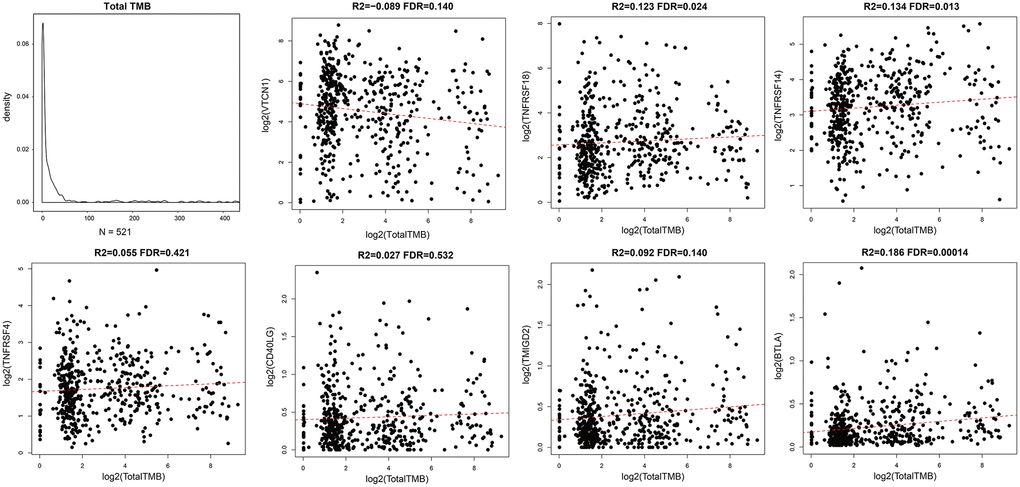
Figure 4.Association between prognostic ICGs and TMB in EC. Scatter plot shows relationship between expression levels of seven prognostic ICGs and TMB. R2, correlation coefficient; FDR, false detection rate. The abscissa represents log2 (Total TMB), and ordinate represents expression levels of seven prognostic ICGs in EC tissues from the TCGA dataset.