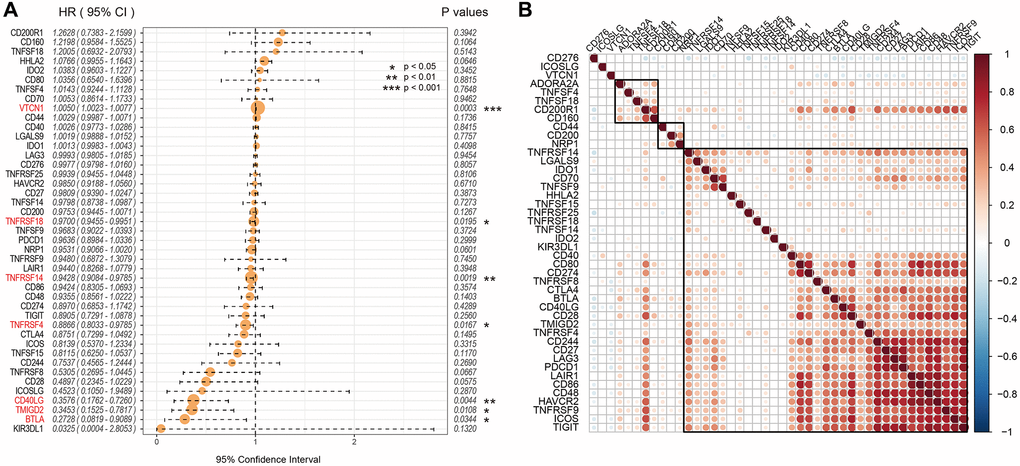
Figure 2.Association between ICGs and prognosis of EC patients from the TCGA dataset. (A) Univariate Cox regression analysis shows association between ICGs and prognosis of EC patients. (B) Spearman correlation analysis shows the relationship between various ICG pairs in EC tissues from the TCGA dataset. Note: Only ICG gene pairs with significant correlations are displayed; blank indicates insignificant correlation.