Submit an Article
Navigate
Home
Editorial Board
Editorial Policies
Current Volume
Archive
Scientific Integrity
Publication Ethics Statements
Interviews with Outstanding Authors
Newsroom
Sponsored Conferences
Podcast
Contact
Special Collections
Submit an Article
Online ISSN: 1945-4589
Research Paper
|
Volume 13, Issue 12
|
pp. 16684–16695
Identification and validation of a robust autophagy-related molecular model for predicting the prognosis of breast cancer patients
Back to article
Figure 2
(2 of 6)
−
100%
+
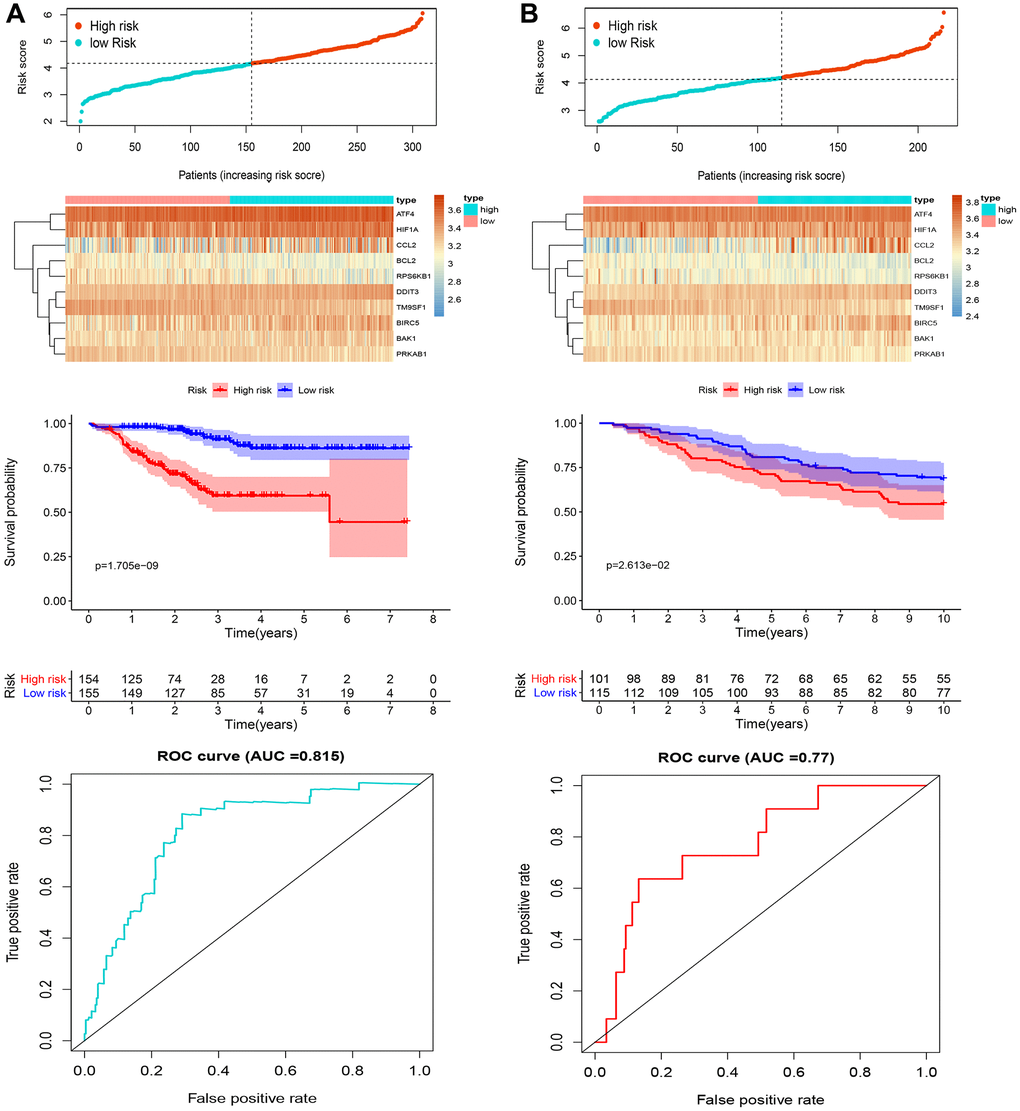
Figure 2.
Analysis of candidate ARGs.
Distribution of risk score, heatmap representation, Kaplan-Meier survival curves, and ROC curves for the autophagy-related signature in (
A
) the training cohort and (
B
) the validation cohort.