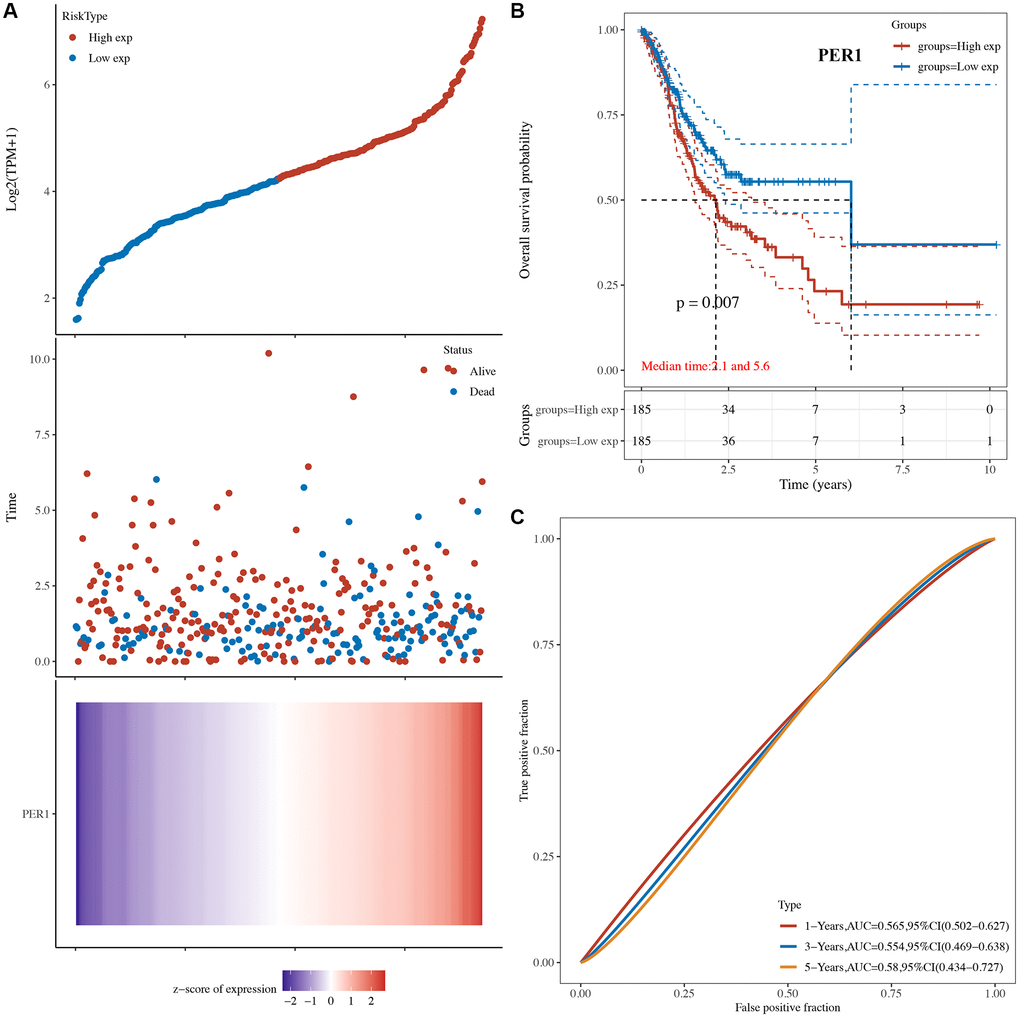
Figure 5.The overall survival analysis of PER1 in STAD. (A) The risk score, survival status and gene expression of each patient. (B) Kaplan-Meier overall survival curve of PER1 in STAD patients with high and low PER1 expression. (C) Time-dependent ROC of PER1 in predicting the prognosis of STAD patients. ROC receiver operating characteristic.