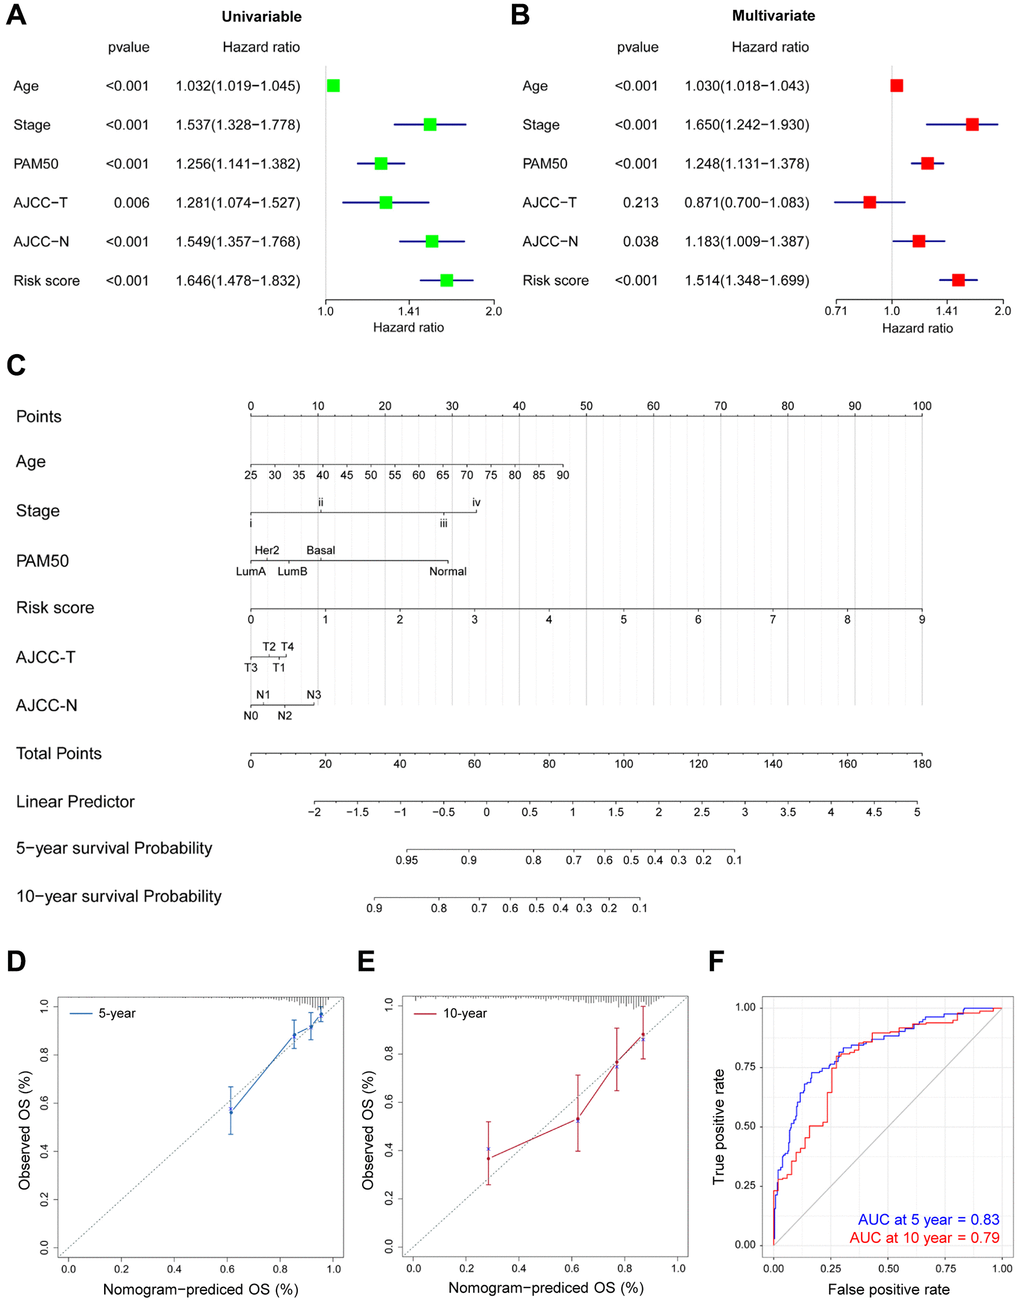
Figure 5.Prognostic nomogram for predicting survival in TCGA-BRCA patients. (A–B) The correlations of the OS risk score and clinical variables by Univariate (A) and Multivariate (B) Cox regression. (C) Prognostic nomogram with certain characteristics in TCGA-BRCA patients. (D–E) The prediction of 5- (D) and 10-year (E) survival by calibration curves. x-axis, predicted OS; y-axis, observed OS; the solid line, predicted nomogram; the vertical bars, 95% confidence interval. (F) Time-ROC curves for the combination of age, stage, PAM50, T, N and risk score.