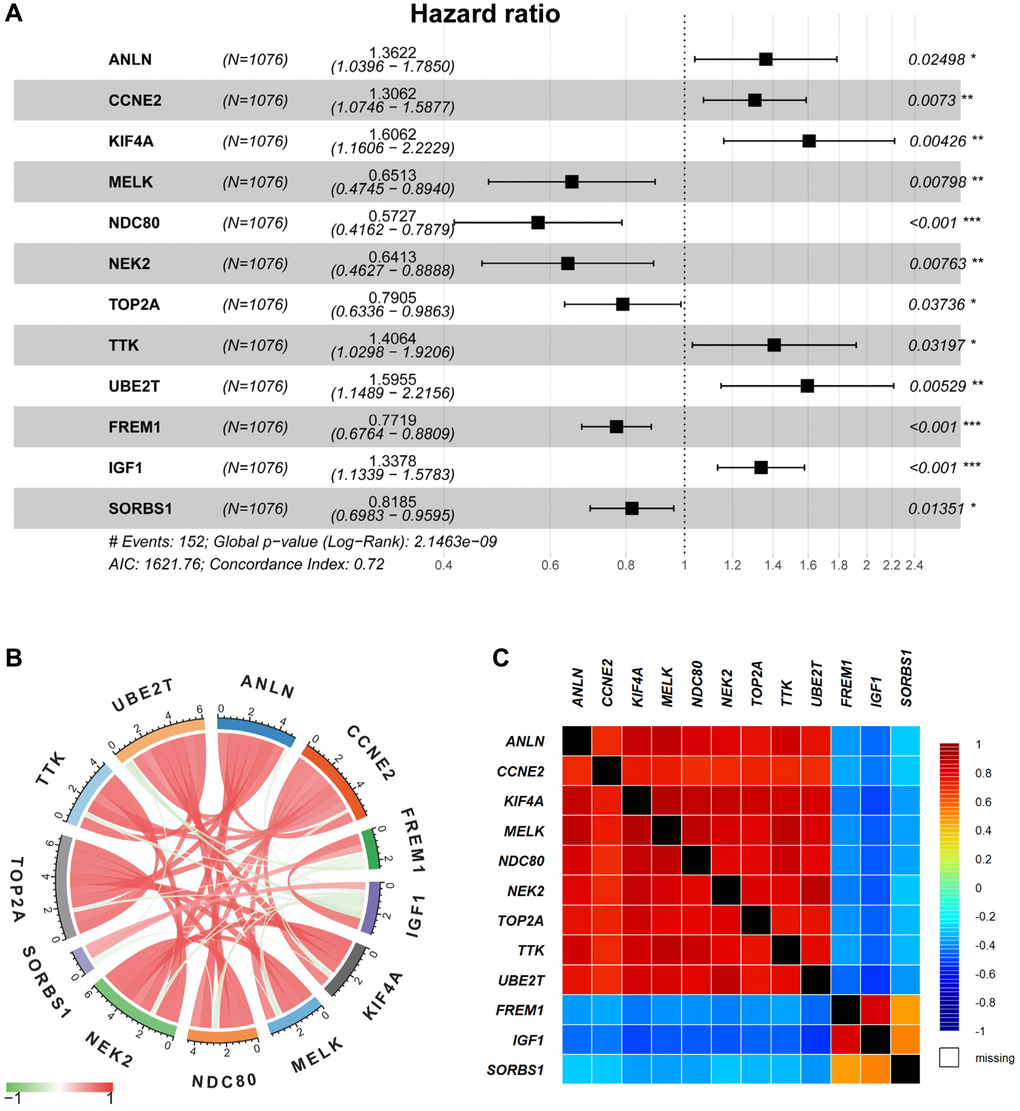
Figure 3.Multivariable Cox regression and correlation analysis. (A) The multivariable Cox regression analysis of 12 selected DEGs were displayed by forest plot. (B–C) The correlation analysis of 12 selected DEGs was displayed by Pearson’s correlation (B) and the bc-GenExMiner software (C), respectively.