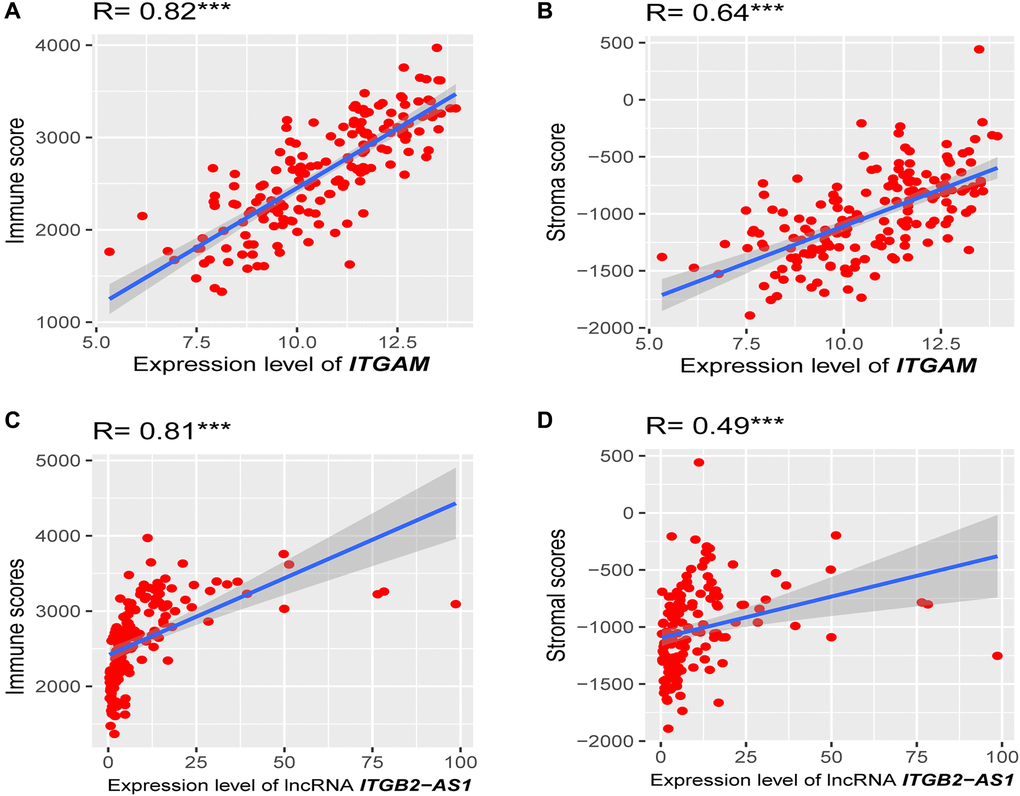
Figure 12.Association of prognostic genes expression levels with the tumor microenvironment (TME). (A) Strong positive correlation between ITGAM expression (log2 transformation) and immune score. (B) A moderate correlation between ITGAM expression (log2 transformation) and stroma score. (C) Strong positive correlation between LncRNA ITGB2-AS1 expression (log2 transformation) and immune score. (D) A moderate correlation between LncRNA ITGB2-AS1 expression (log2 transformation) and stroma score. R, Spearman’s correlation coefficient; ***P < 0.001.