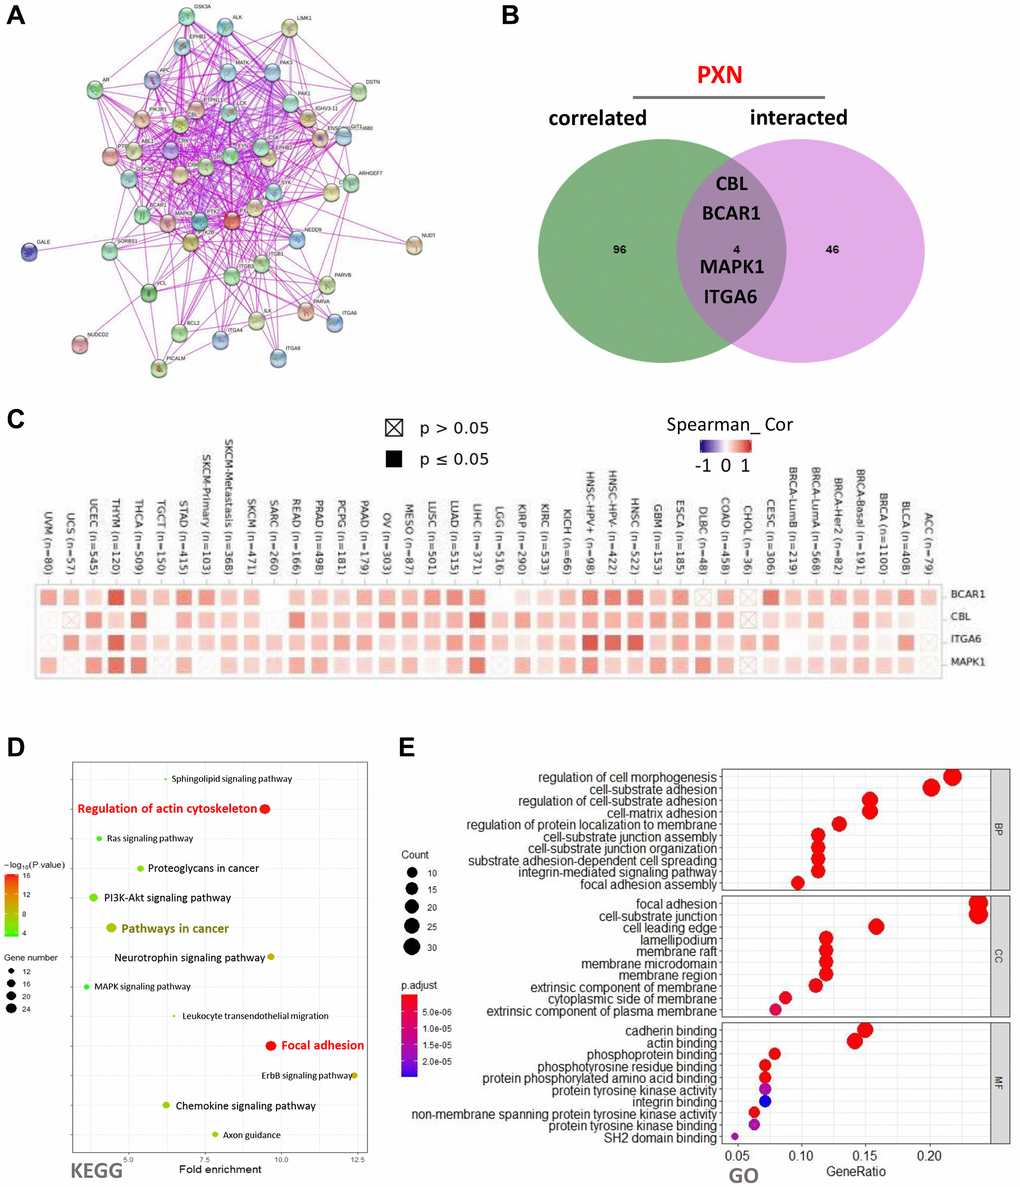
Figure 9.PXN-related gene enrichment analysis (A) using the STRING tool to obtain the available experimentally determined PXN-binding proteins; (B) as an intersection analysis of PXN-binding and correlated genes; and (C) as a corresponding heatmap of the detailed cancer types. (D–E) KEGG pathway analysis of PXN-binding and interacting genes, represented by a dot plot of the biological process, the cellular component, and the molecular function data in the GO analysis.