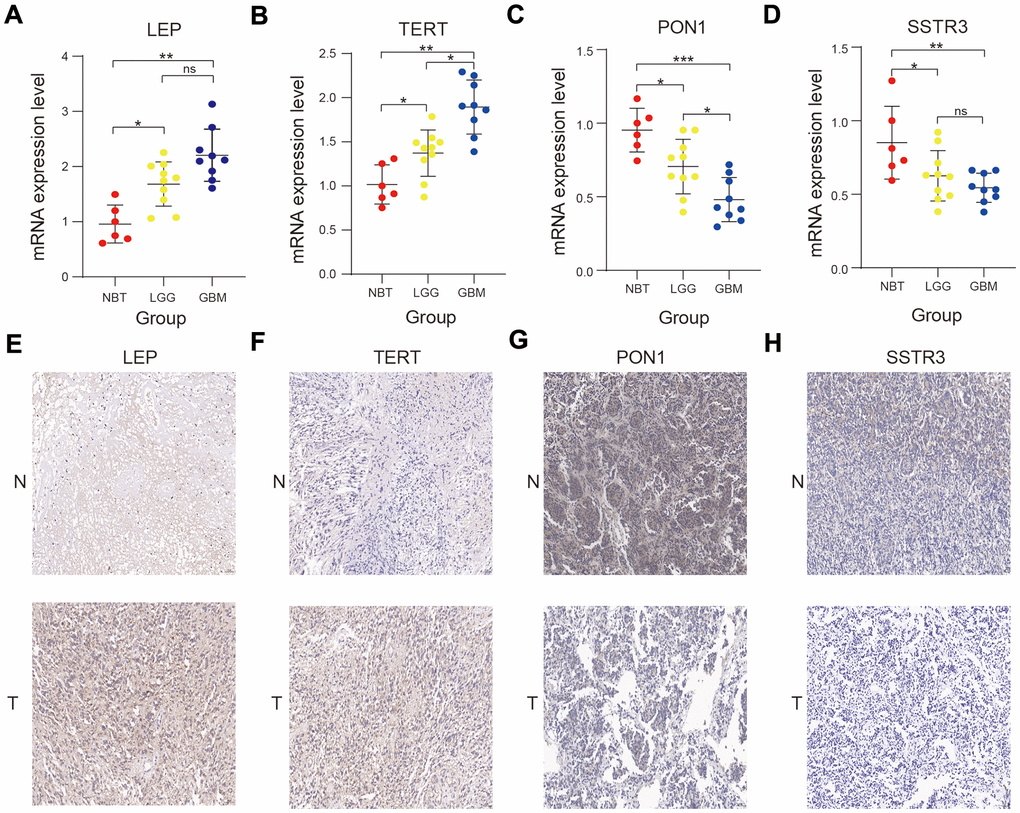
Figure 8.Validation of the bioinformatics results using RT-qPCR and immunohistochemistry assay. (A–D) Comparison of LEP (A), TERT (B), PON1 (C), and SSTR3 (D) mRNA expression levels in normal brain tissue (NBT), lower-grade glioma (LGG), and glioblastoma (GBM) tissues by RT-qPCR assay. (E–H) Comparison of the protein expression of LEP (E), TERT (F), PON1(G) and SSTR3 (H) in NBT and glioma tissue by immunohistochemistry assay. Non-significant (ns) P > 0.05, * P < 0.05, ** P < 0.01, and *** P < 0.001.