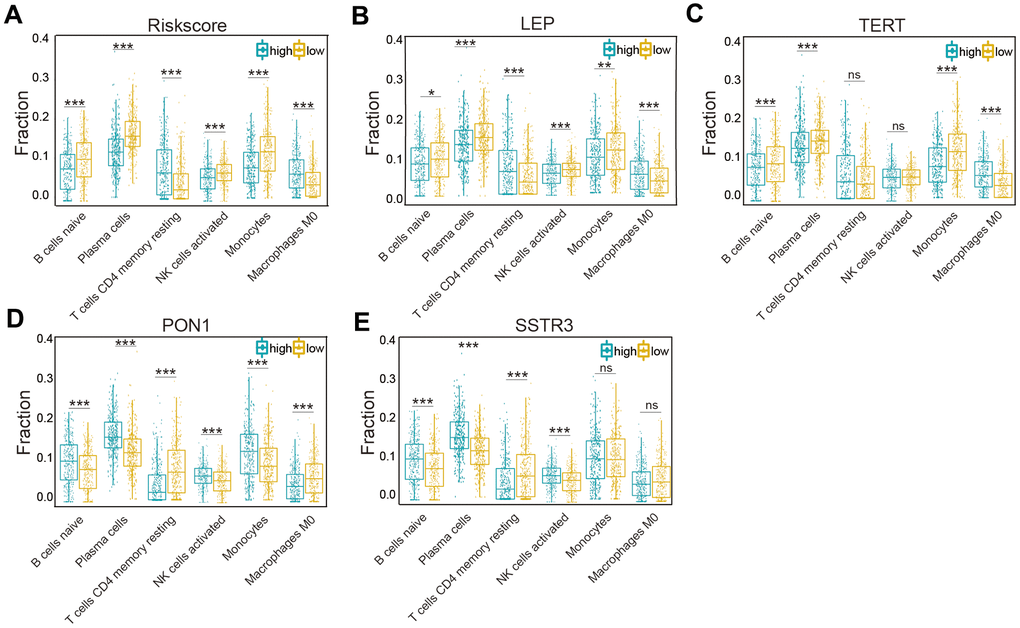
Figure 7.Association of six types of immune cells with the risk score and four selected AGs in the TCGA datasets. (A) Distributions of the six types of immune cells (naïve B cells, plasma cells, CD4 memory resting T cells, NK activated cells, monocytes, and M0 macrophages) in the two subtypes grouped by the median risk score. (B–E) Comparison of the six types of immune cells (naïve B cells, plasma cells, CD4 memory resting T cells, NK activated cells, monocytes, and M0 macrophages) according to LEP (B), TERT (C), PON1 (D), and SSTR3 (E) expression levels. Non-significant (ns) P > 0.05, * P < 0.05, ** P < 0.01, and *** P < 0.001.