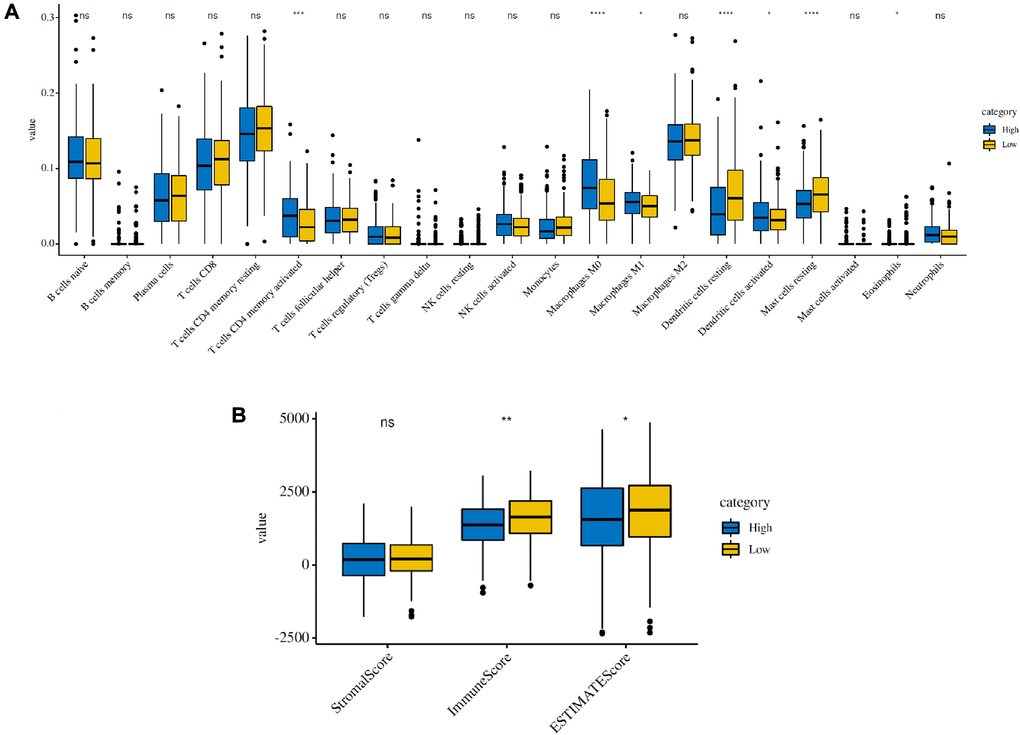
Figure 5.Immune infiltration in the high-risk and low-risk groups in the TCGA cohort. (A) The infiltrating levels of 21 immune cell types in the two groups (cluster 1/2). *p < 0.05 and **p < 0.01. (B) Immune score and stromal score of the two groups.