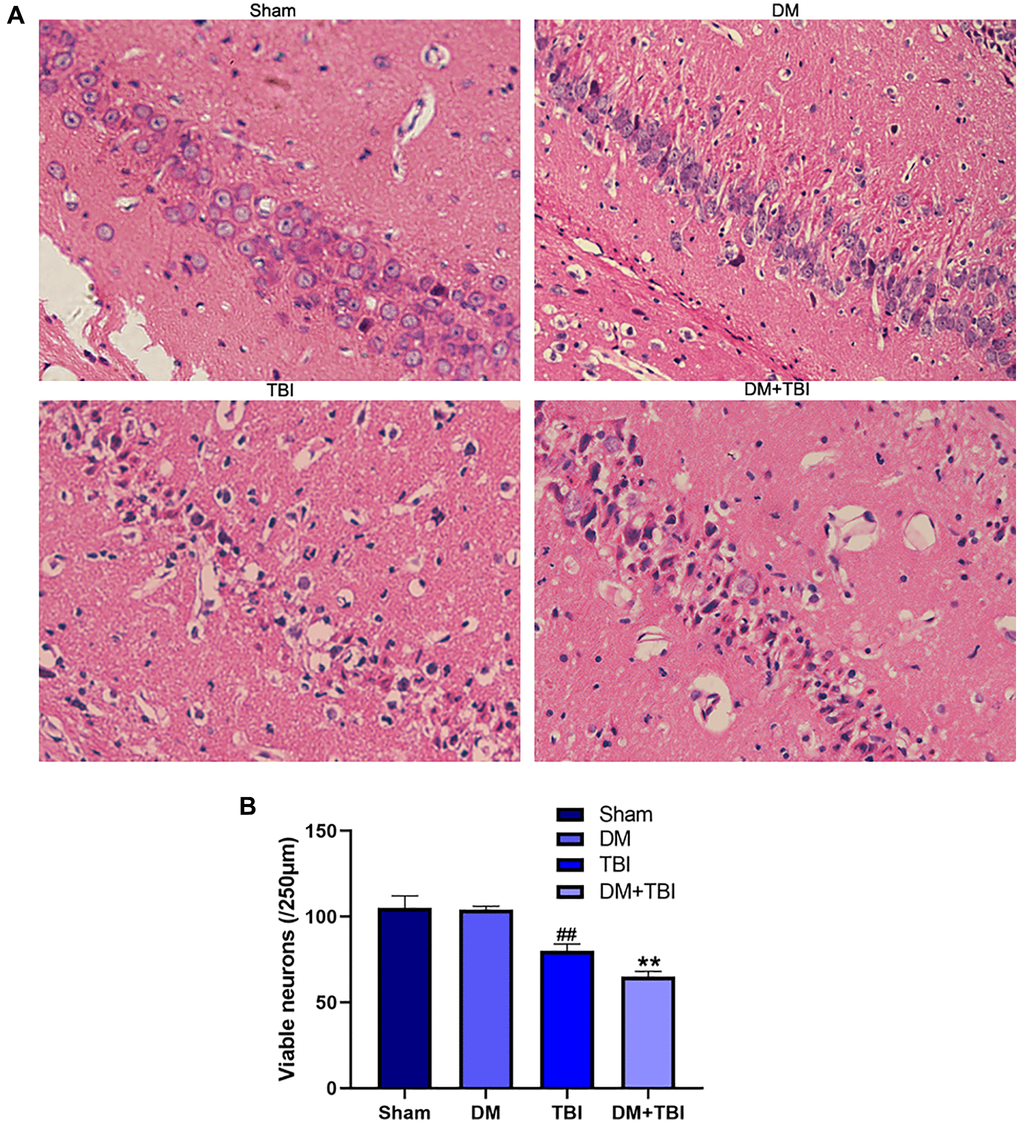
Figure 2.HG aggravated pathological injuries caused by TBI. (A) Hematoxylin and eosin staining (scale bar, 20 μm). (B) Quantification of the number of viable neurons per 250-lm length in each group. All data are presented as the mean ± standard error (n = 4 per group). Statistical significance was determined using one-way ANOVA followed by post-hoc Bonferroni correction. ##P < 0.01 vs. the Sham group; **P < 0.01 vs. the TBI group.