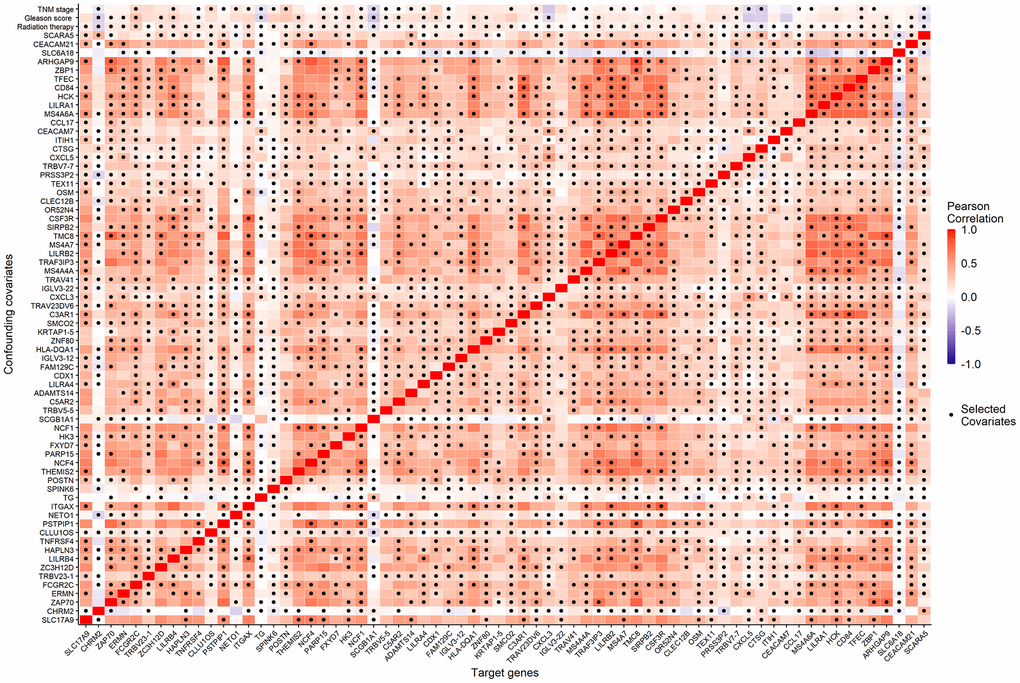
Figure 4.The Pearson correlation coefficients (the corresponding color) of the 68 candidate genes (horizontal axis) and the 70 candidate confounding covariates (vertical axis), as well as the minimal confounding covariate set of each candidate gene (the dark dot of each column).