Submit an Article
Navigate
Home
Editorial Board
Editorial Policies
Current Volume
Archive
Scientific Integrity
Publication Ethics Statements
Interviews with Outstanding Authors
Newsroom
Sponsored Conferences
Podcast
Contact
Special Collections
Submit an Article
Online ISSN: 1945-4589
Research Paper
|
Volume 13, Issue 11
|
pp. 14571–14589
Revealing the therapeutic targets and molecular mechanisms of emodin-treated coronavirus disease 2019 via a systematic study of network pharmacology
Back to article
Figure 6
(6 of 9)
−
100%
+
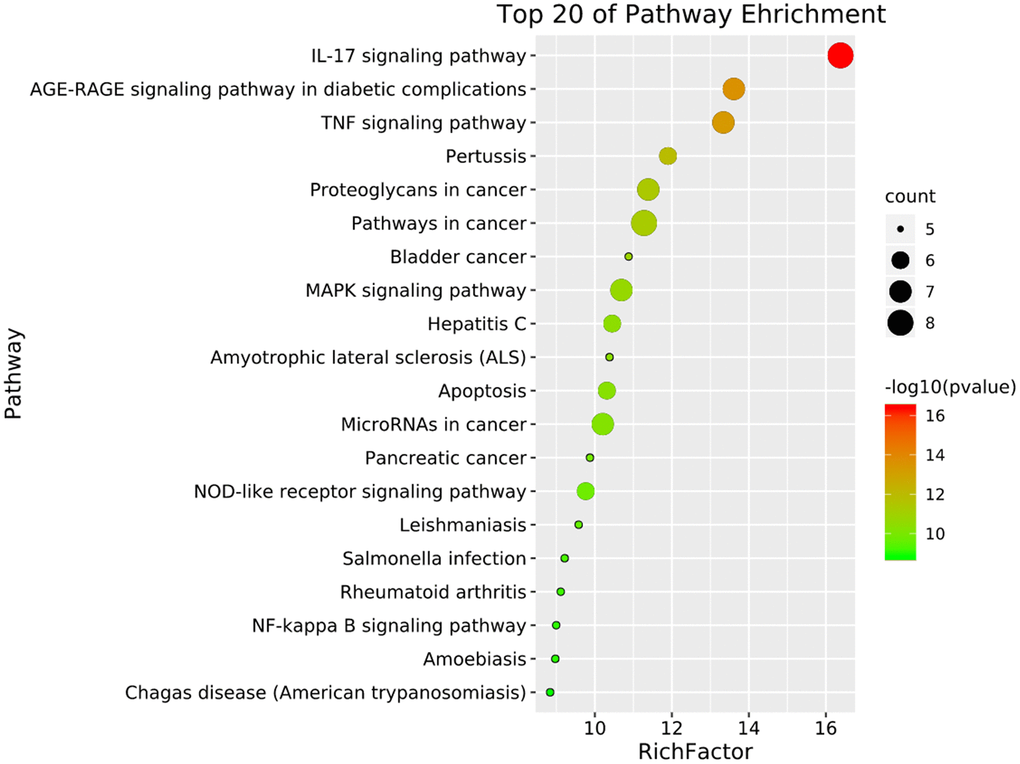
Figure 6.
The top 20 signaling pathways from KEGG enrichment analysis were showed by the bubble diagram with count algorithms and
p
-values.
Each node signals one KEGG pathway, and its size represents the gene number. The color indicates the
p
-value.