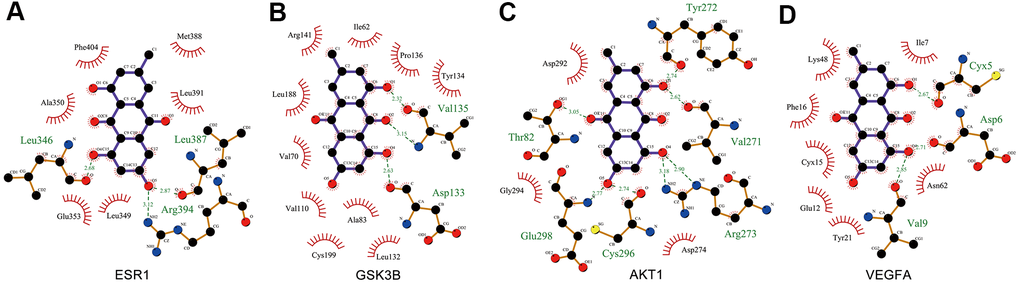
Figure 7.Interaction between EMO and core targets by docking analysis. LigPlus schematic 2D representation of EMO-core target interactions (A–D). Hydrogen bonds between EMO and the core target are represented by green dashed lines. The amino acid residues of the core target interacting with EMO are shown as brown sticks and labeled in green.