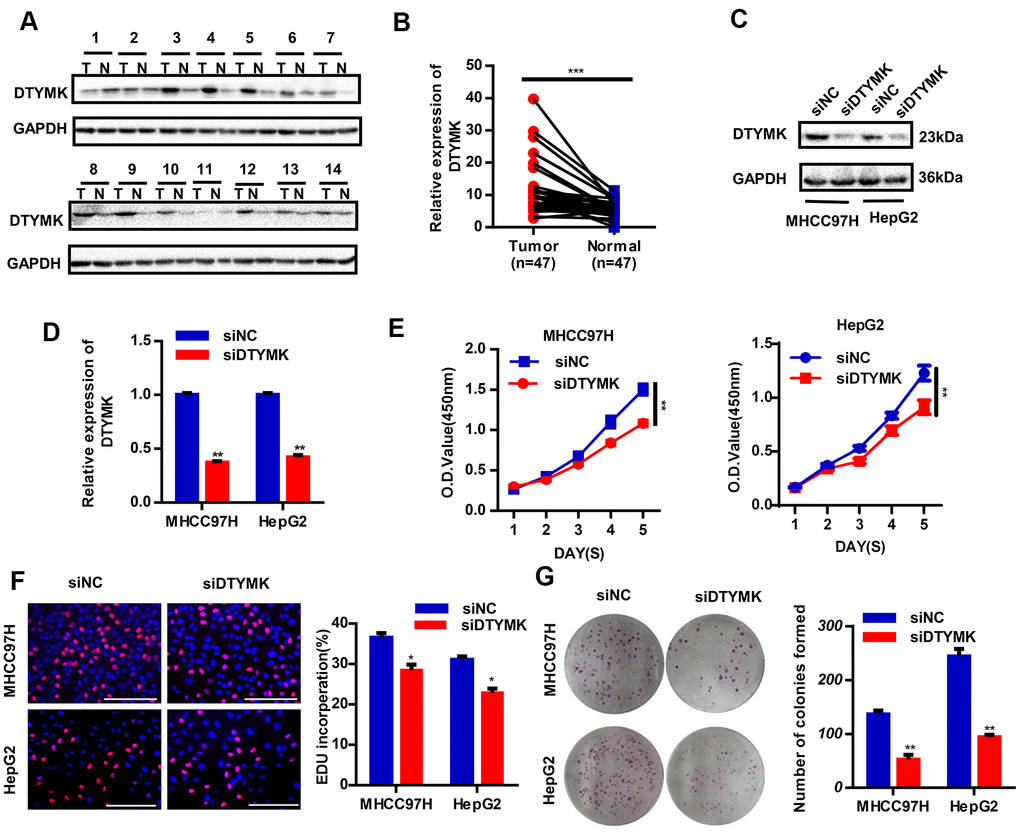
Figure 7.Validation of DTYMK’s expression and function. (A) The expression levels of DTYMK in HCC and adjacent noncancer tissues were evaluated by Western blot (n=47). (B) Statistical analysis of relative DTYMK levels in HCC tissues compared to normal tissue controls (n= 47). (C, D) Transfection efficiency was verified after transfection of siDTYMK or negative control siRNA. (E) HCC cell viability was evaluated with CCK-8 assays. (F) EdU assay showed change of proliferative rate after transfection with siDTYMK. (G) The number of HCC cell colonies was reduced after transfection with siDTYMK. *** represents p < 0.001, ** represents P < 0.01, * represents P < 0.05.