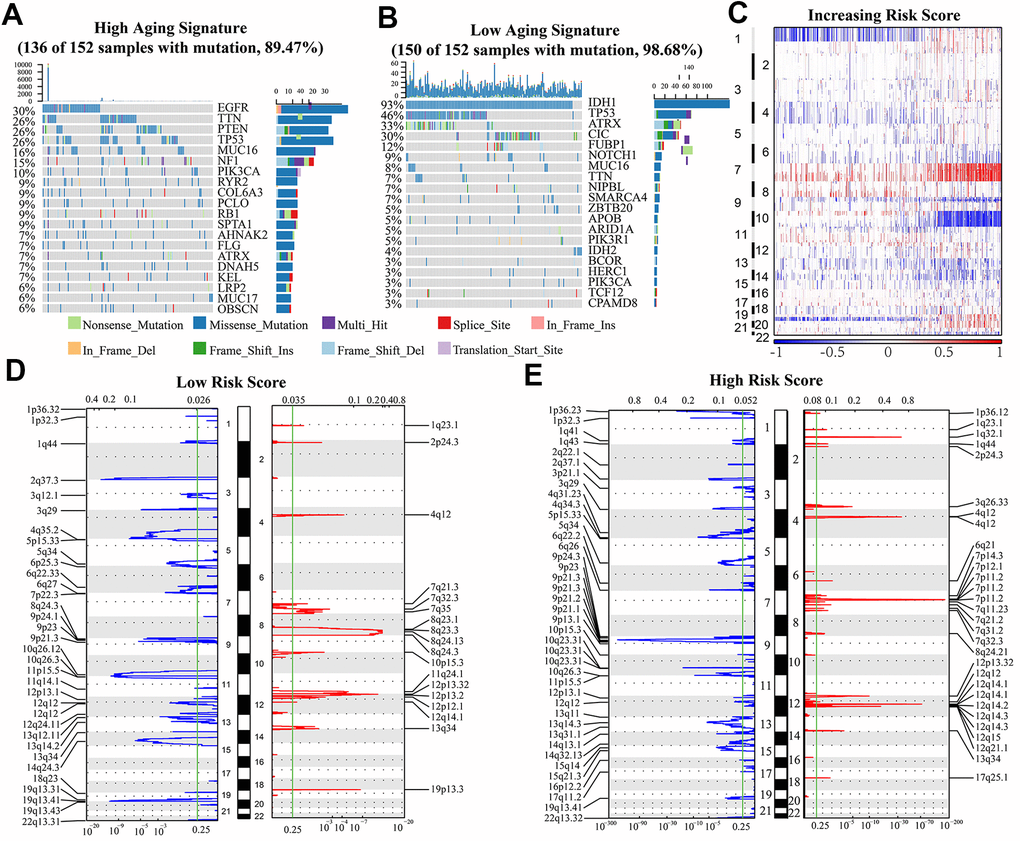
Figure 5.(A, B) Genes with the highest mutation frequency in high and low risk groups. The overall CNAs profiles (C) were shown according to risk score. (D, E) Chromosomal regions that were significantly amplified (red) and deleted (blue) were identified using GISTIC 2.0 analysis. The threshold for significance was represented by the green line (q value=0.25).