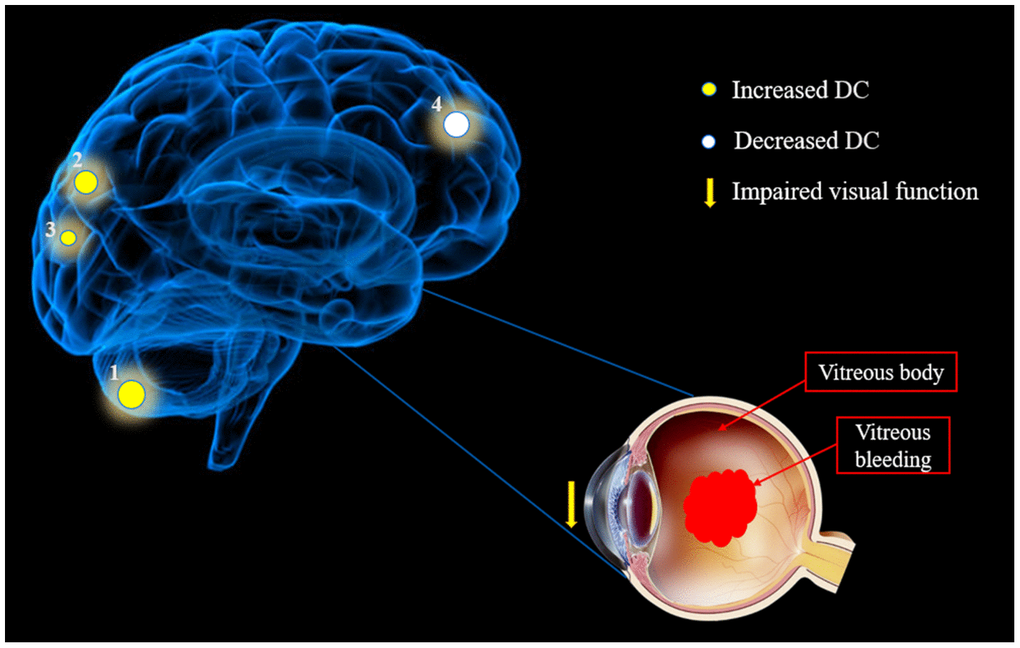
Figure 6.The mean DC values of altered brain regions in the hypertensive retinopathy group. Notes: Compared with the HCs, the DC values of the following regions were increased to various extents: 1- Cerebellum Posterior Lobe. L (-, t=4.4835), 2- Medial Occipital Gyrus. L (BA19, t=4.3309) and 3- Precuneus. B (-, t=3.9827), whereas the DC value of the following region was decreased: 4- Medial Frontal Gyrus/B Anterior Cingulate. R (-, t = -4.2564). The sizes of the spots denote the degree of quantitative changes. Abbreviations: DC, degree centrality; HCs, healthy controls; L, left; R, right; B, Bilateral; BA, Brodmann's area.