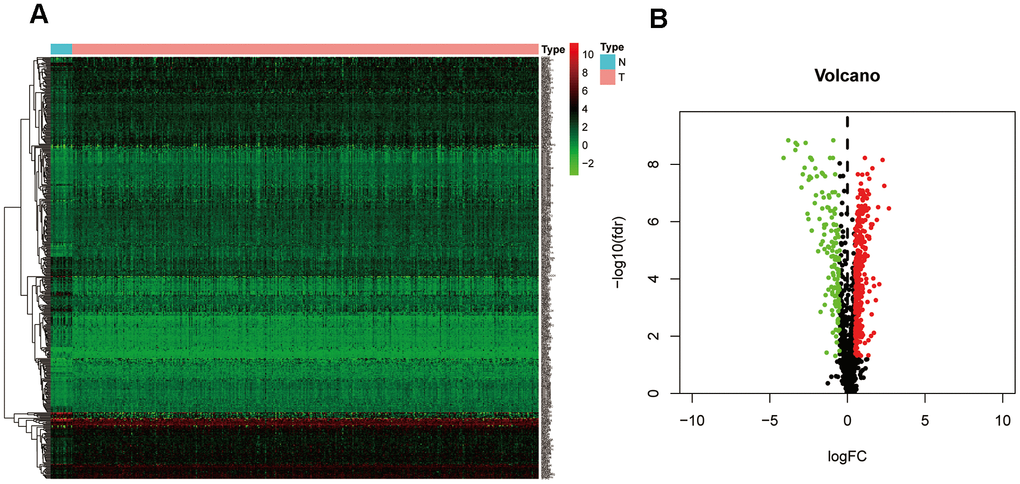
Figure 2.Identification of differentially expressed ZNF genes in the TCGA-BC cohort. (A) Heatmap depicting the expression levels of ZNF genes in tumor (T) and normal (N) samples. (B) Volcano plot representation of differentially expressed ZNF genes in the TCGA-BC cohort.