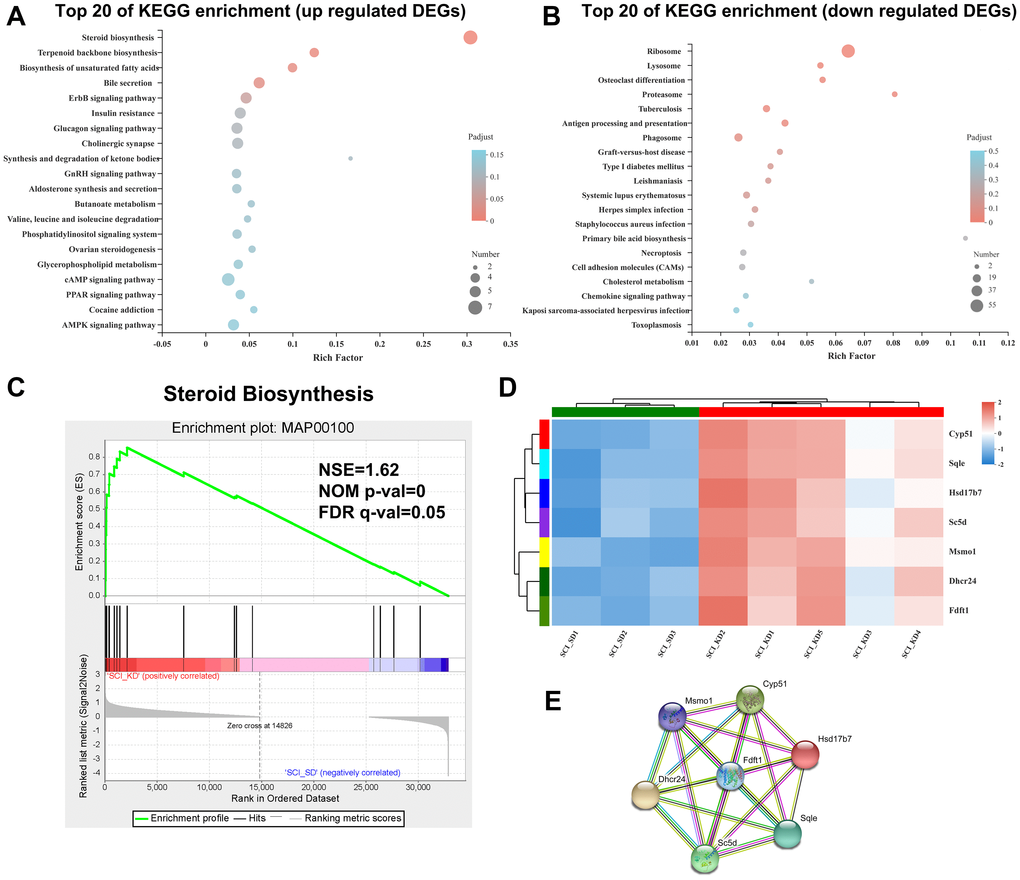
Figure 3.Enrichment analysis of DEGs in the SCI_KD vs. the SCI_SD group. (A) KEGG enrichment bubble diagram of the upregulated DEGs from the SCI_KD and SCI_SD groups. (B) KEGG enrichment bubble diagram of the downregulated DEGs from the SCI_KD and SCI_SD groups. (C) The GSEA analysis diagram of steroid biosynthesis between SCI_KD and SCI_SD. (D) Cluster analysis of KEGG-enriched DEGs. (E) Protein-protein interaction of DEGs between the SCI_KD and SCI_SD groups.